Dashboard - Pie Chart Visual
When creating a dashboard item it is important to know what you want to display. We recommend having some questions in mind of what you want the dashboard to show before you start creating it.
The Dataset used in this dashboard is a sample of a Black Friday sales. The Dataset contains information about Age, Occupation, Gender, Marital Status, Purchased Items, Purchase Price, City of residence etc.
I would like to find out the following from the Dashboard:
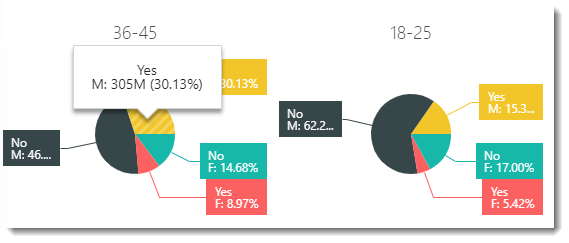
- Who spends more on Black Friday, Men or Women?
- Does Marital Status have an effect on spending habits?
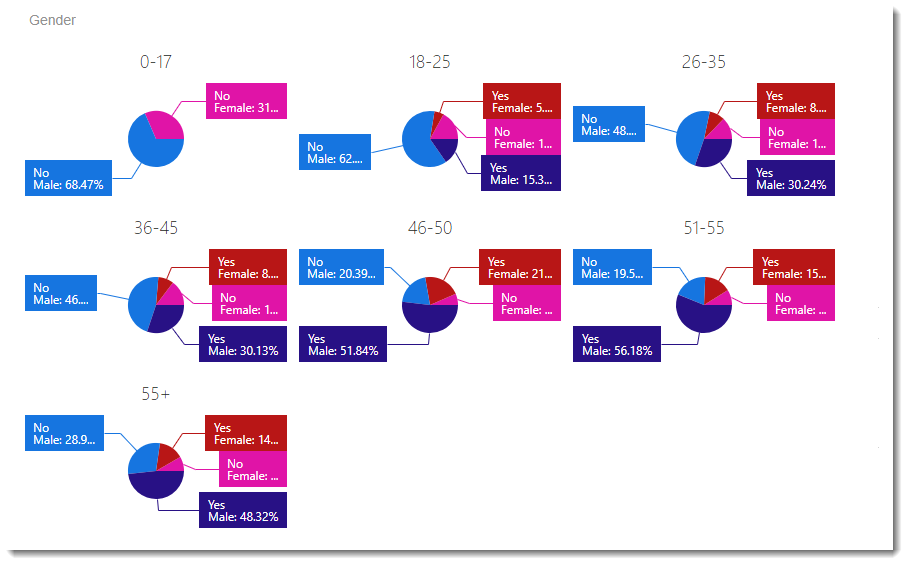
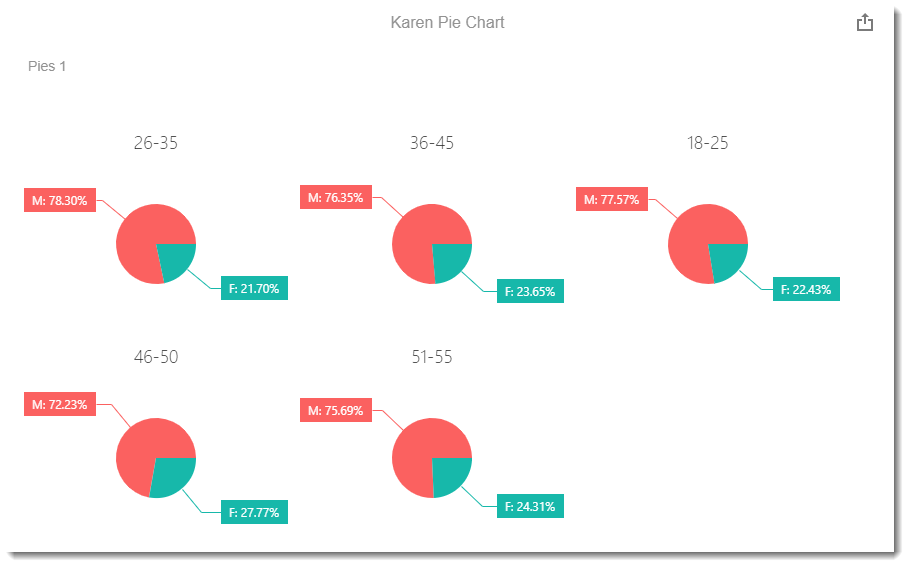
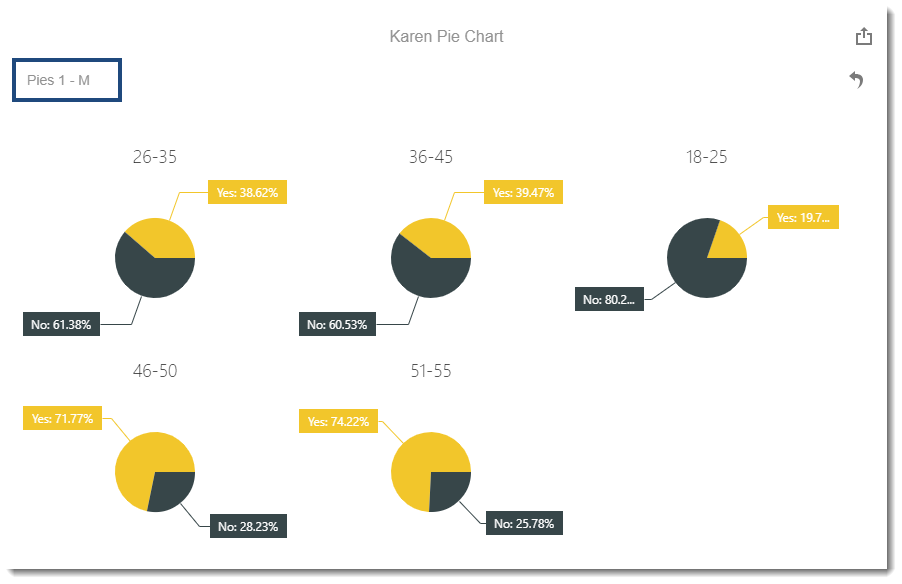
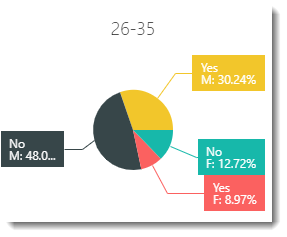
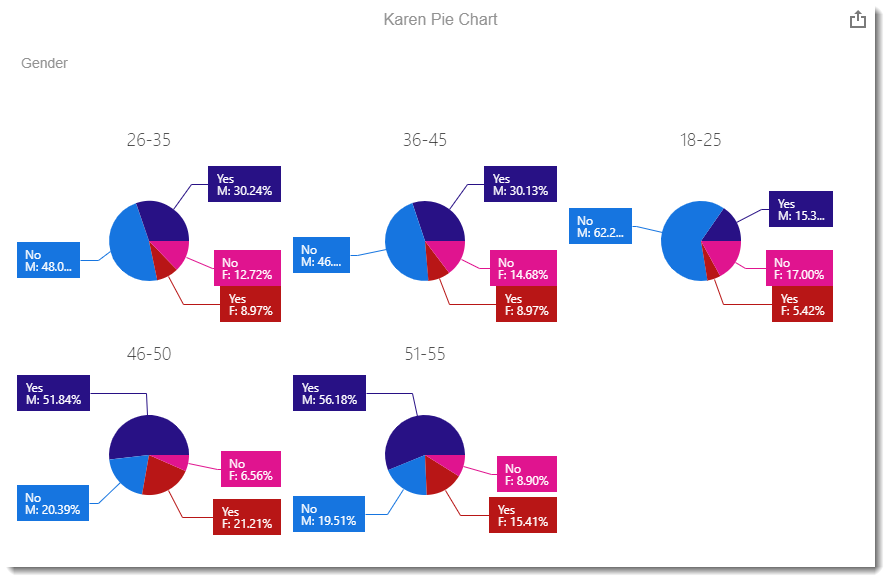
Below is an example of a Pie Chart Visual created based on the two questions above:
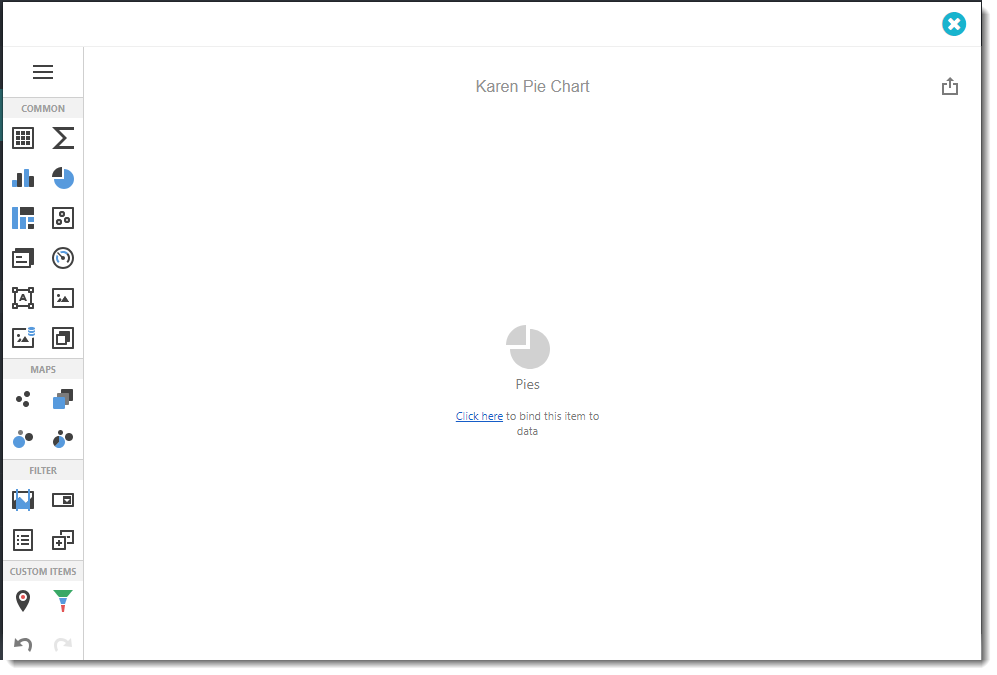
- To create this visual, begin by selecting Pie Chart.
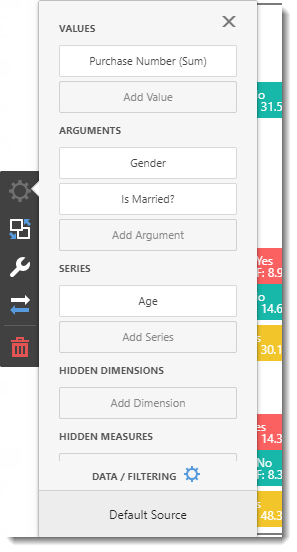
Binding Menu
- Use the Click here to bring up the Binding Menu. The Binding Menu allows you to create and modify the data selected for the dashboard.
Values
- Values section contains data items that define the share of pie segments.
- Select the value for the information you are going to show.
- Click Add Value.
- Once you click Add column, select the required data in the Binding section.
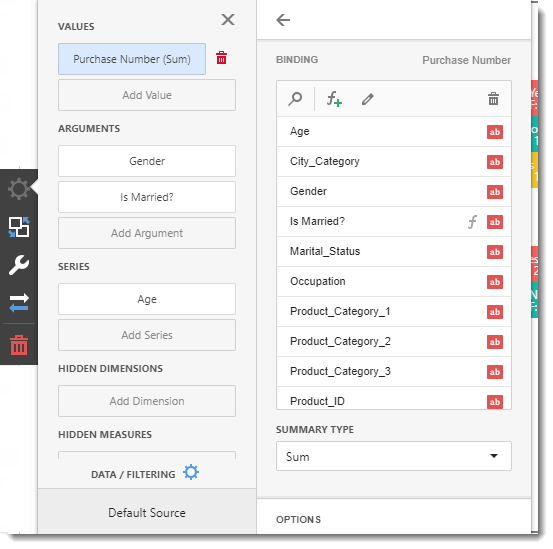
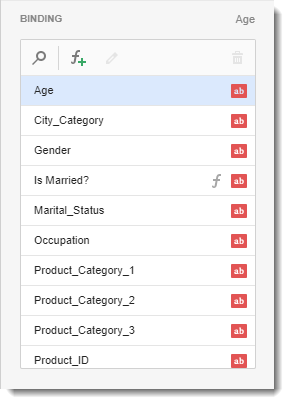
Binding
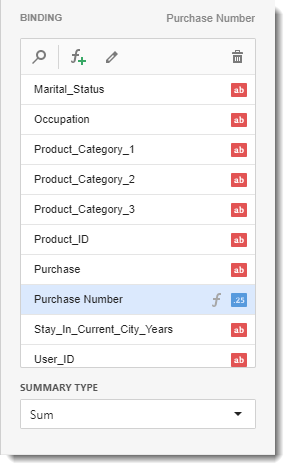
- Select the value for the information you are going to show.
For the example above I am going to show the Purchase Number as a Sum.
- You may need to use a calculated field. To create a calculated field use the F+ button. You will need to use SQL Queries for this.
Please seek assistance from your IT department as we do not provide SQL Query support.
- Summary Type: Select which type of summary variable you would like.
Options
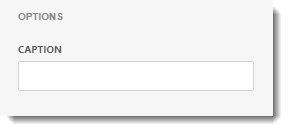
- Caption: This is the heading for the value selected. It is best to caption the visual with a variation of the question asked at the beginning of creating the dashboard.
Calculations
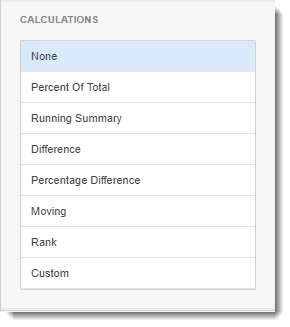
- In this section, it will automatically calculate the value by selecting one of the options.
Format
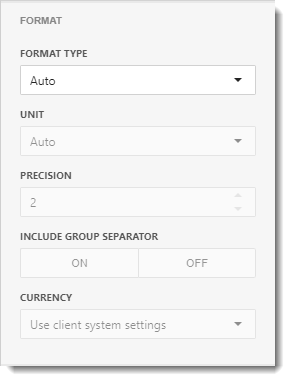
- In this section, you have the option to select the format type and unit to the value.
Arguments
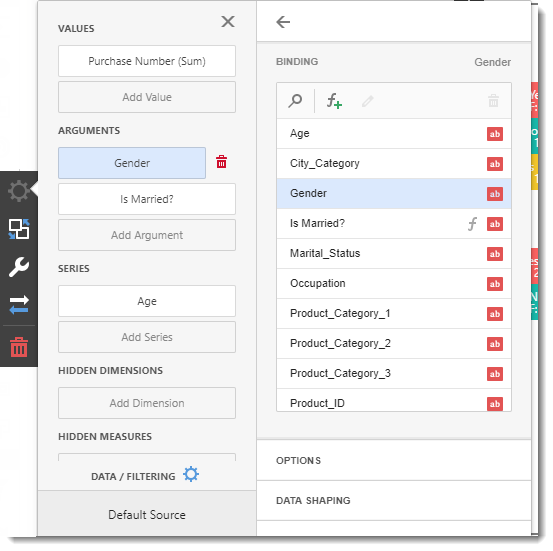
- Arguments section contains data items that provide values used to label pie segments.
- Select the argument for the information you are going to show.
- Click Add Argument.
- Once you click Add Argument, select the required data in the Binding section.
Binding
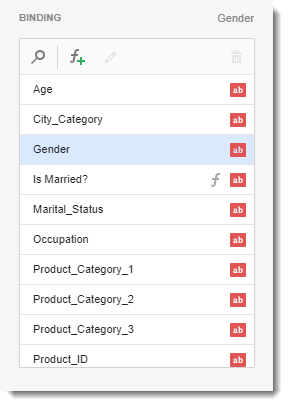
- Select the value for the information you are going to show.
For the example above I am going to show the Gender.
- You may need to use a calculated field. To create a calculated field use the F+ button. You will need to use SQL Queries for this.
Please seek assistance from your IT department as we do not provide SQL Query support.
Options
- Caption: This is the heading for the argument selected. It is best to caption the visual with a variation of the question asked at the beginning of creating the dashboard.
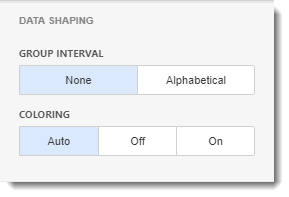
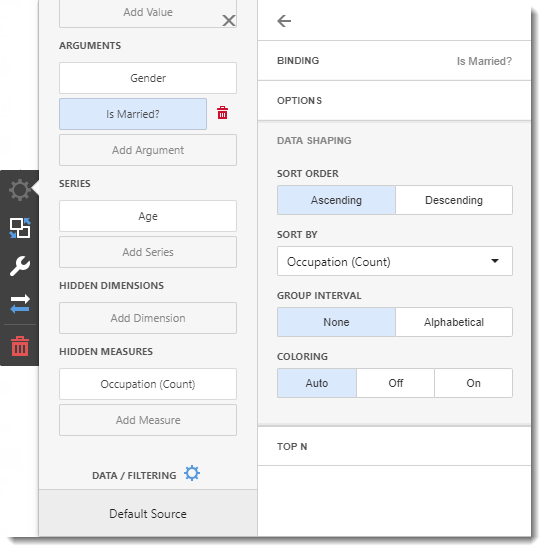
Data Shaping
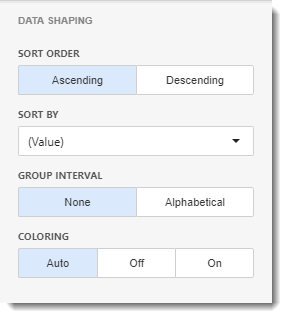
- In this section, you can change the sort order of the value and enable or disable the coloring.
- Sort Order: You can select Ascending or Descending sort order.
- Sort By: Select the value you want to sort this data.
- Group Interval: You can set group intervals by alphabetical or none.
- Coloring: You can set the coloring options to Automatic, Off, and customize the color by selecting On.
Top N
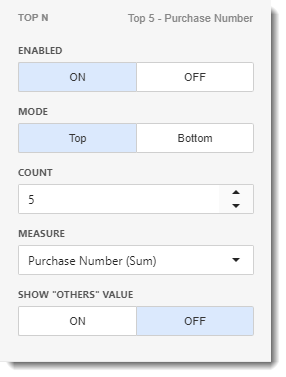
- In this section, you can customize the display number of values that correspond to the highest or lowest values of a particular measure.
- Enable this option by clicking ON.
- Mode: Specifies whether top or bottom values should be displayed.
- Count: The number of Values you want to display.
- Measure: The measure selected which the top or bottom values will be determined.
- Show "Others" Value: If enabled, all values that are not shown in the top/bottom ones will be displayed in the "Others" value.
Series
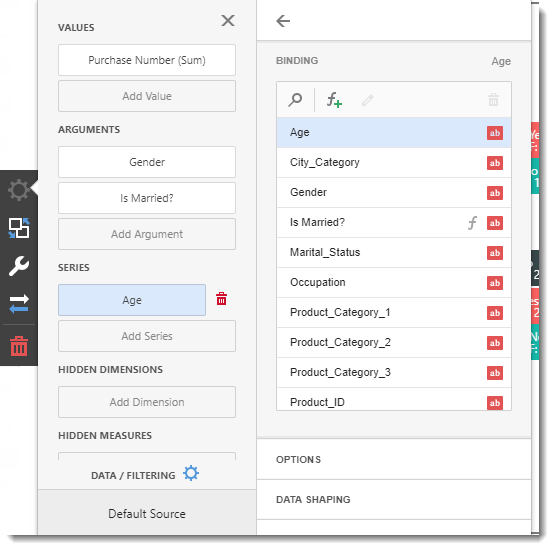
- Series section contains data items whose values are used to label pie charts.
- Select the series for the information you are going to show.
- Click Add Series.
- Once you click Add Series, select the required data in the Binding section.
Binding
Options
- Caption: This is the heading for the series selected. It is best to caption the visual with a variation of the question asked at the beginning of creating the dashboard.
Data Shaping
- In this section, you can change the sort order of the value and enable or disable the coloring.
- Group Interval: You can set group intervals by alphabetical or none.
- Coloring: You can set the coloring options to Automatic, Off, and customize the color by selecting On.
Top N
- In this section, you can customize the display number of values that correspond to the highest or lowest values of a particular measure.
- Enable this option by clicking ON.
- Mode: Specifies whether top or bottom values should be displayed.
- Count: The number of Values you want to display.
- Measure: The measure selected which the top or bottom values will be determined.
- Show "Others" Value: If enabled, all values that are not shown in the top/bottom ones will be displayed in the "Others" value.
Hidden Dimensions/Hidden Measures
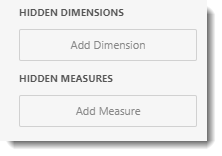
- This section is used to utilize a field without displaying in the dashboard item. Adding the Hidden dimension or measure, you can sort any values in the data by that specific dimension/measure.
- This section is to sort or filter the visual dashboard in order to get more detailed analysis.
- You can use Hidden Dimensions/ Hidden Measures with the following sections:
- Data/Filtering
- Data Shaping
- Common
- Top N
If the value is already added in the binding menu, you don't need to add it in the Hidden Dimensions/Measures.
In this example, we want to sort the individuals by their occupation.
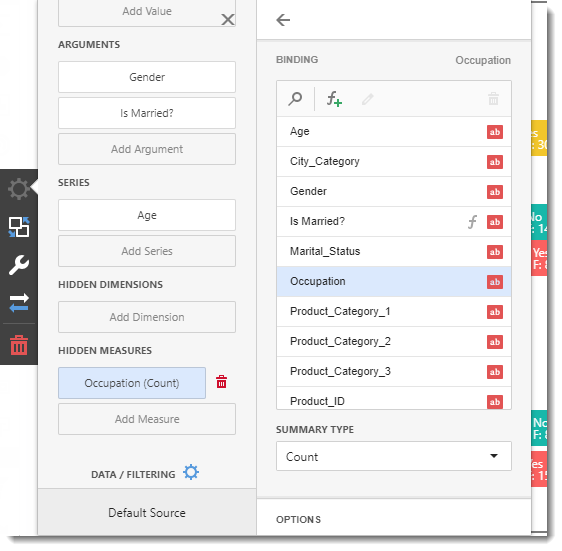
- After the data is added in the Hidden Measure, select the argument and/or values you want to filter.
In this case, I want to sort Is Married? by Occupation. Select Arguments and select Is Married? and click Data Shaping. In Data Shaping, go to the Sort By section and select Occupation.
Interactivity Menu
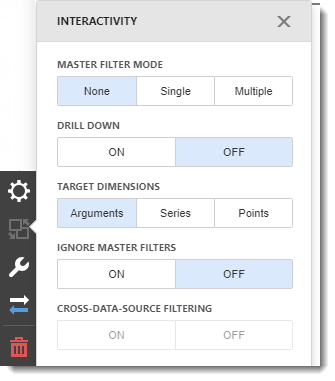
- The interactivity features enables interaction between several variable in the Pie Chart.
Master Filter Mode
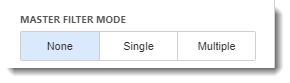
- This mode allows you to use any data aware item ad a filter for other dashboard items.
- None: Disables master filtering.
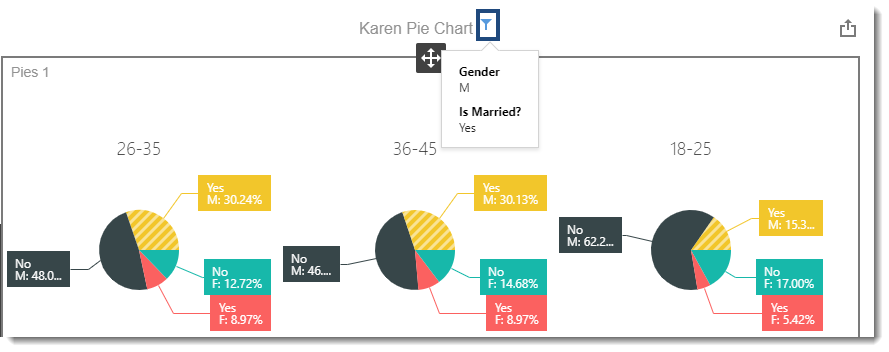
- Single: Allows you to select only one element in the Master Filter item. When this mode is enabled, the default selection will be set to a Master Filter element. You can change this selection, but cannot clear it.
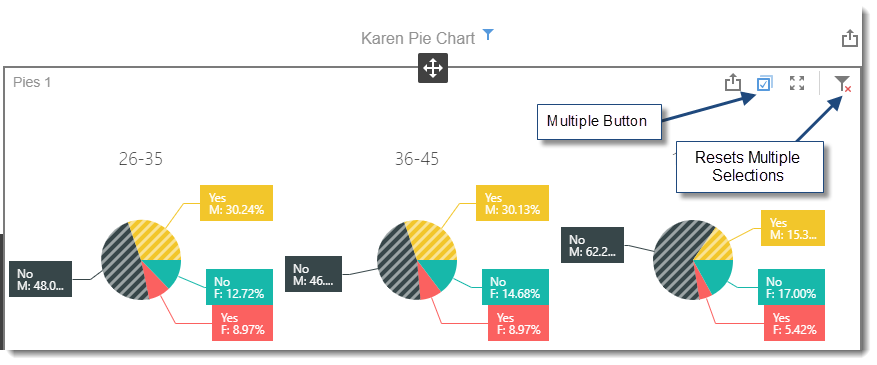
- Multiple: Allows you to select multiple elements in the Master Filter item. To reset filtering, use the Reset Multiple Selections button in the Pie Chart.
Drill Down
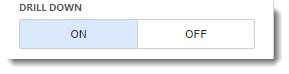
- This mode allows you to change the detail level of the data displayed. Drill-Down enables users to drill down to display detail data, or drill up to view more general information.
Target Dimensions
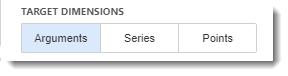
- When using Master Filter Mode, you have the option to select the data by Arguments, Series, and Points.
- Arguments: When you filter by Arguments, it displays only the data related to the selected argument values.
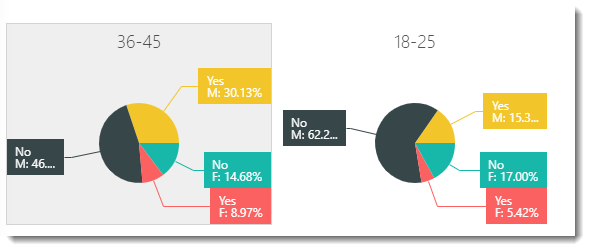
- Series: When you filter by Series, it displays the whole pie chart selected.
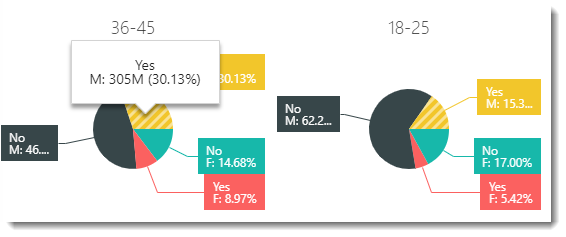
- Points: When you filter by Points, it displays only that segment selected.
Ignore Master Filters
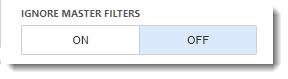
- You have the option to enable or disable Master Filters.
Cross-Data-Source Filtering
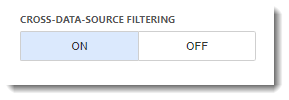
- In this mode, when different items in a dashboard are bound to different data sources, you can specify that a particular Master Filter should be applied across data sources. This means that it will apply filtering to fields with matching names in all data sources.
Options Menu
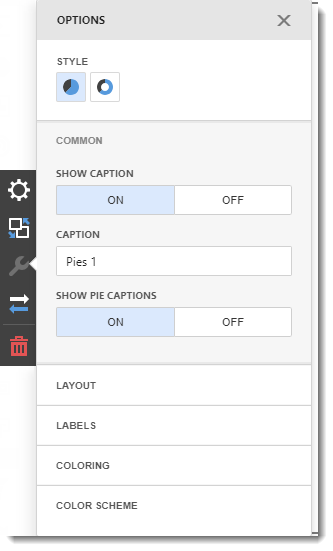
- In this section, contains specific options and settings related to the dashboard item.
Style
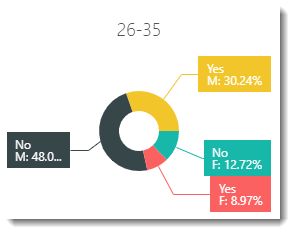
- You may select the types of diagram for you Pie Chart Visual.
- Pie
- Donut
Common
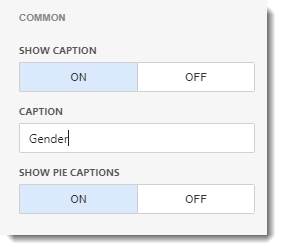
- Show Caption: You can enable or disable the visual caption.
- Caption: This is the heading for the visual selected. It is best to caption the visual with a variation of the question asked at the beginning of creating the dashboard.
- Show Pie Caption: You can enable or disables the series caption.
Layout
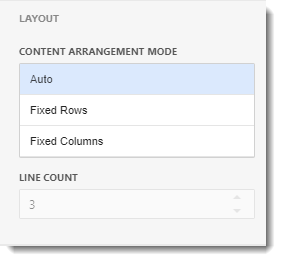
- In this section, you can specify how many pie charts you want in columns or row.
- Auto: Automatically place the pie charts to fit in the visual.
- Fixed Rows: You can specify how many pie charts you want in row using Line Count.
- Fixed Columns: You can specify how many pie charts you want in column using Line Count.
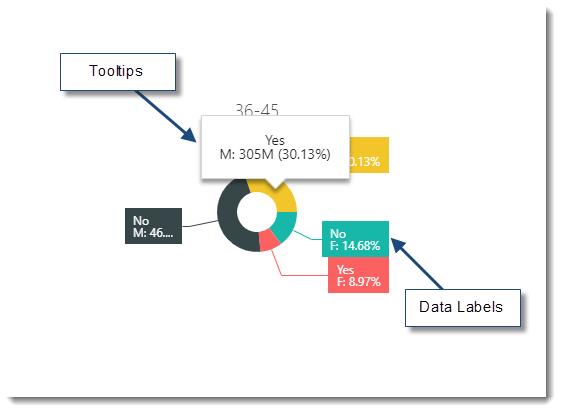
Labels
- In this section, you can edit the Data labels and tooltips information.
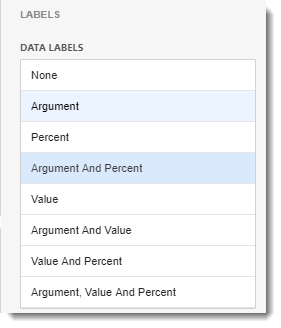
- Data Labels
- None: No Data Labels displayed.
- Argument: Data Labels will be displayed with the Arguments section data.
- Percent: Data Labels will be displayed in percentage.
- Value: Data Labels will be displayed with the Value section data.
- Argument and Value: Data Labels will be displayed with the argument and value section value.
- Value and Percent: Data Labels will be displayed with the value section and percentage.
- Argument, Value and Percent: Data Labels will be displayed with the argument section, value section, and percentage.
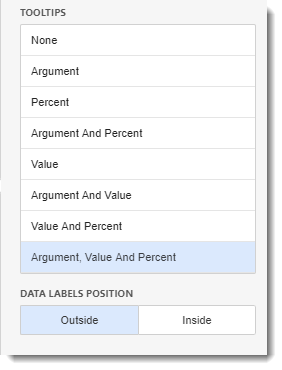
- Tooltips
- None: No Tooltips displayed.
- Argument: Tooltips will be displayed with the Arguments section data.
- Percent: Tooltips will be displayed in percentage.
- Value: Tooltips will be displayed with the Value section data.
- Argument and Value: Tooltips will be displayed with the argument and value section value.
- Value and Percent: Tooltips will be displayed with the value section and percentage.
- Argument, Value and Percent: Tooltips will be displayed with the argument section, value section, and percentage.
- Data Labels Position: You can set the Data Labels inside or outside the pie chart.
Coloring
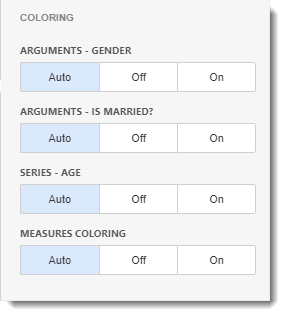
- You can change or enable colors to the arguments, series, and measure coloring in the Pie Chart Visual. You can change the default palette used to color Pie Chart tiles. For this, go to Color Scheme section.
Color Scheme
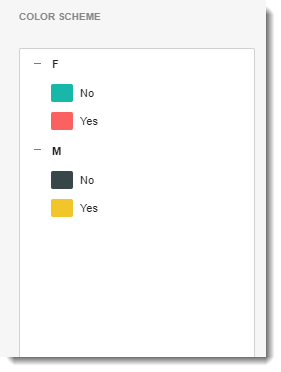
- In order to change the color to each argument click on the colored box.
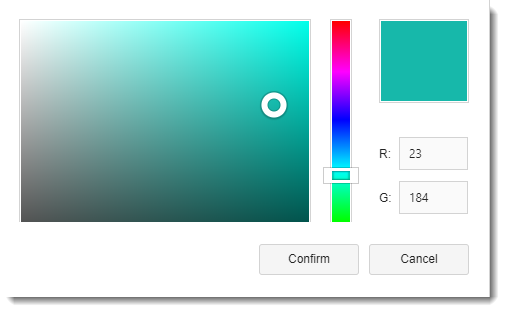
- Select the color you want and click Confirm to change the color.
Convert To Menu
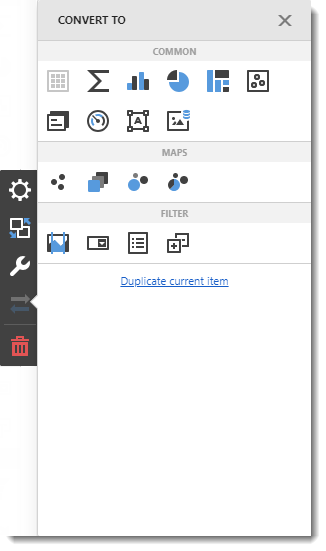
- In this section, you have the option to convert or duplicate the current dashboard item.
Remove Button

- Click on the remove button to delete the current dashboard item.