Dashboard - Web Visual
When creating a dashboard item it is important to know what you want to display. We recommend having an idea what you want the dashboard to show before you start creating it.
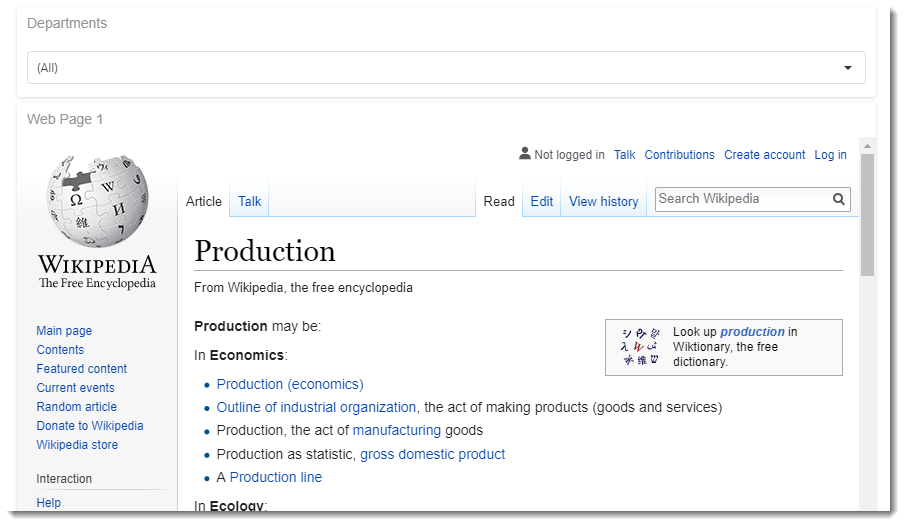
Below is an example of a Web Visual created:
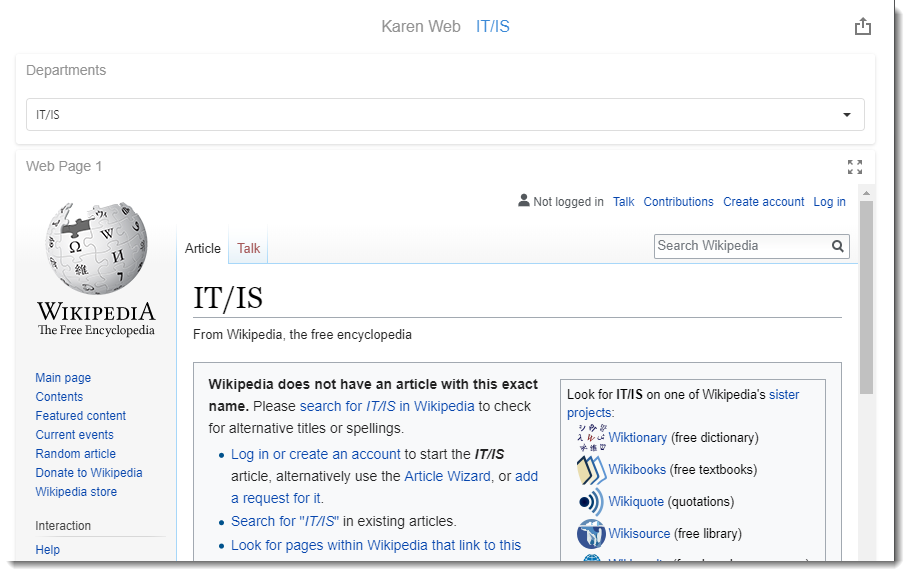
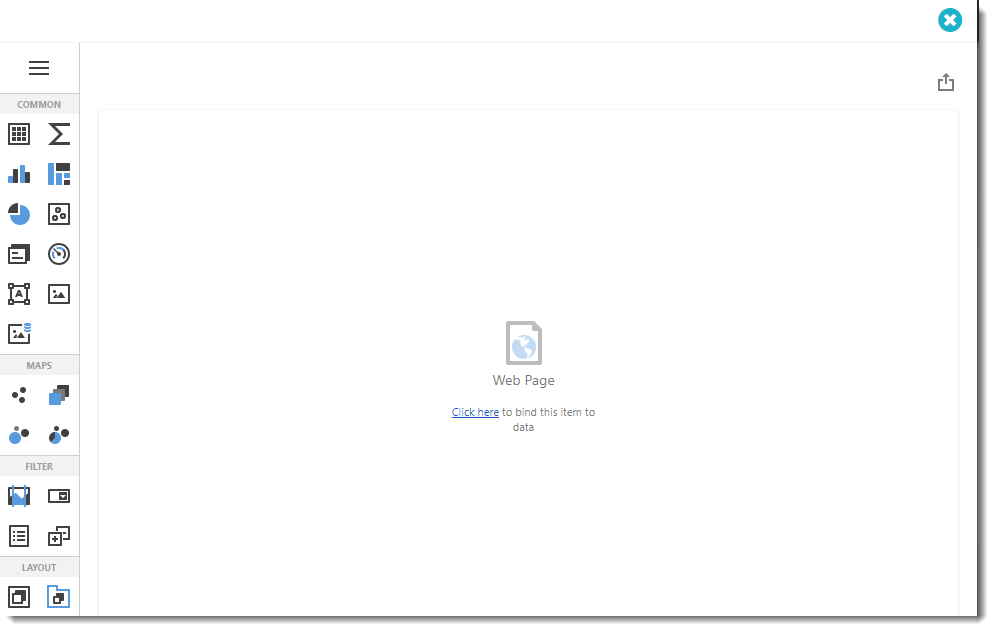
- To create this visual, begin by selecting Web.
- The Web Visual is to insert a web page in a dashboard. The Web Visual can be also used to search the data using a filter box.
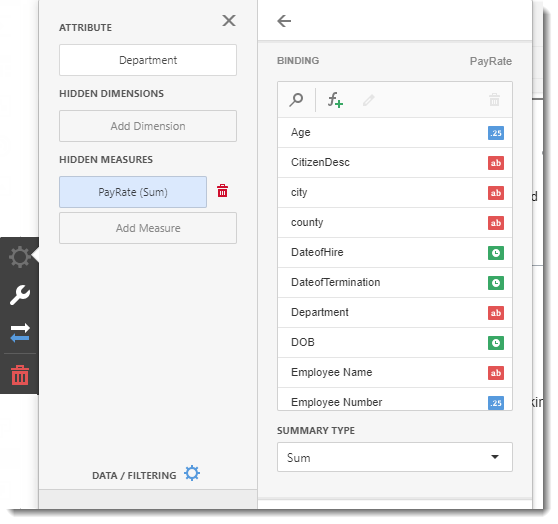
Binding Menu
- Use the Click here to bring up the Binding Menu. The Binding Menu allows you to create and modify the data selected for the dashboard.
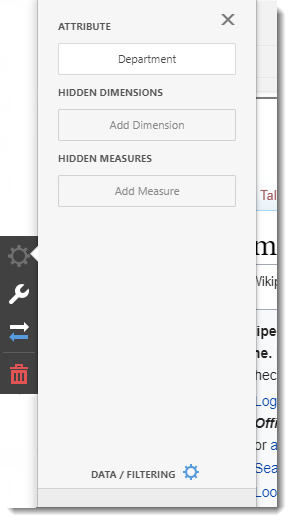
Attribute
- The attribute section contains data to search on the web page.
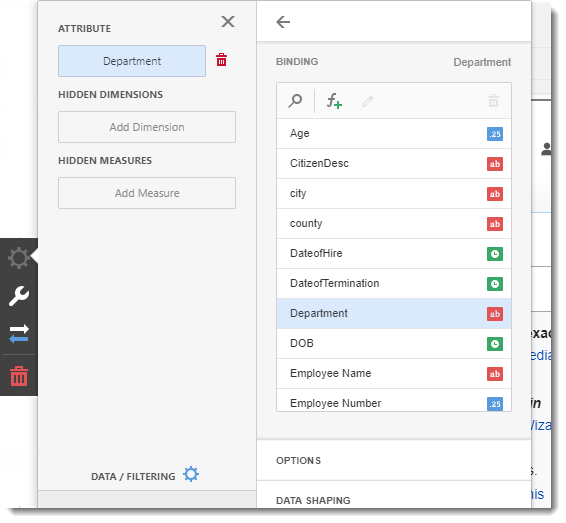
Binding
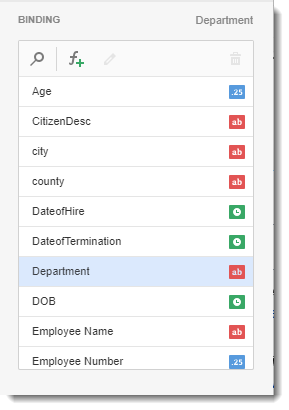
- Select the value for the information you are going to show.
For the example above I am going to show the Departments.
- You may need to use a calculated field. To create a calculated field use the F+ button. You will need to use SQL Queries for this.
Please seek assistance from your IT department as we do not provide SQL Query support.
Options
- Caption: This is the heading for the attribute selected. It is best to caption the visual with a variation of the question asked at the beginning of creating the dashboard.
Data Shaping
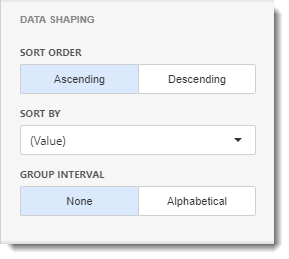
- Sort Order: You can select Ascending or Descending sort order.
- Sort By: Select the value you want to sort this data.
- Group Interval: You can set group intervals by alphabetical or none.
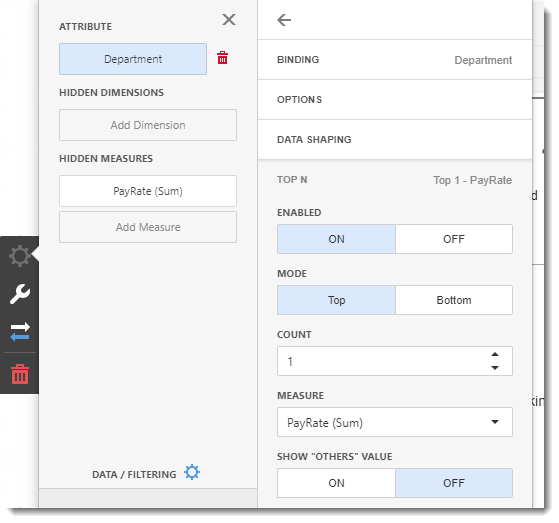
Top N
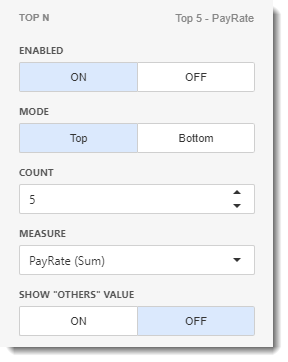
- In this section, you can customize the display number of values that correspond to the highest or lowest values of a particular measure.
- Enable this option by clicking ON.
- Mode: Specifies whether top or bottom values should be displayed.
- Count: The number of Values you want to display.
- Measure: The measure selected which the top or bottom values will be determined.
- Show "Others" Value: If enabled, all values that are not shown in the top/bottom ones will be displayed in the "Others" value.
Hidden Dimensions/Hidden Measures
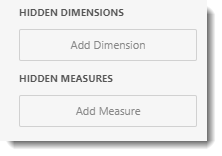
- This section is used to utilize a field without displaying in the dashboard item. Adding the Hidden dimension or measure, you can sort any values in the data by that specific dimension/measure.
- This section is to sort or filter the visual dashboard in order to get more detailed analysis.
- You can use Hidden Dimensions/ Hidden Measures with the following sections:
- Data/Filtering
- Data Shaping
- Common
- Top N
If the value is already added in the binding menu, you don't need to add it in the Hidden Dimensions/Measures.
In this example, we want to search on the web page the department with the lowest pay rate.
- After the data is added in the Hidden Measure, select the argument and/or values you want to filter.
Go to Attribute and select Department. In department, click Top N. In Top N, go to Measure section and select Pay Rate.
Options Menu
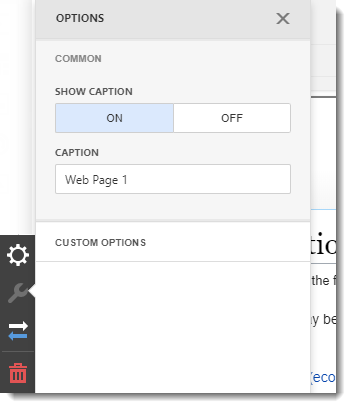
Common
- Show Caption: You can enable or disable the visual caption.
- Caption: This is the heading for the visual selected. It is best to caption the visual with a variation of the question asked at the beginning of creating the dashboard.
Custom Options
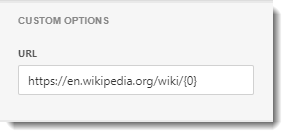
- In this section, you can change and see the URL of the Web page.
Please remember to always put '{0}' a the end of the URL.
Convert To Menu
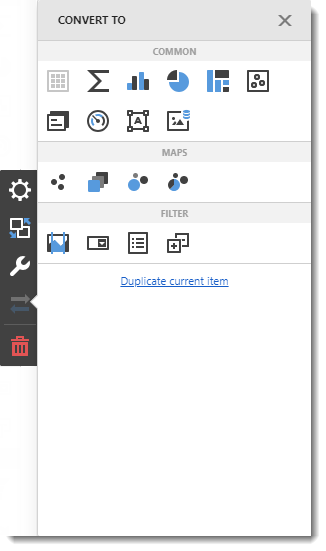
- In this section, you have the option to convert or duplicate the current dashboard item.
Remove Button

- Click on the remove button to delete the current dashboard item.