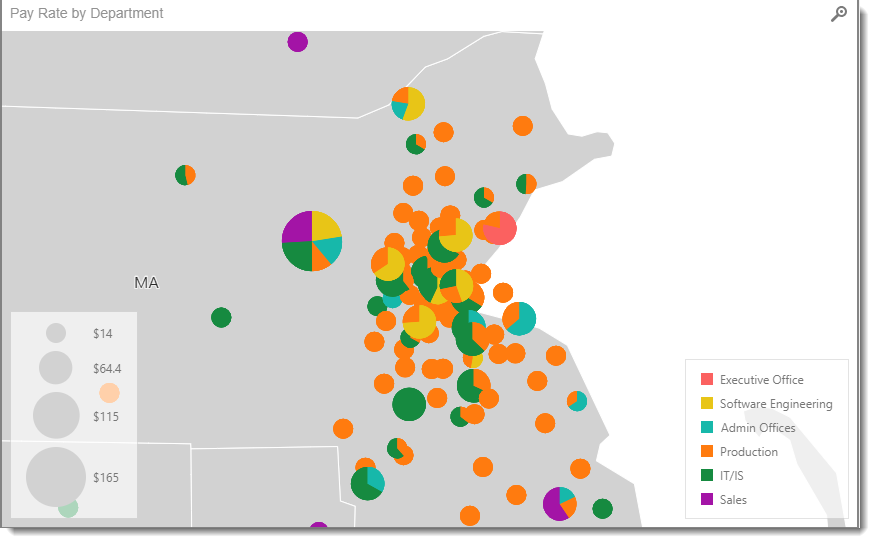
Dashboard - Pie Map
When creating a dashboard item it is important to know what you want to display. We recommend having some questions in mind of what you want the dashboard to show before you start creating it.
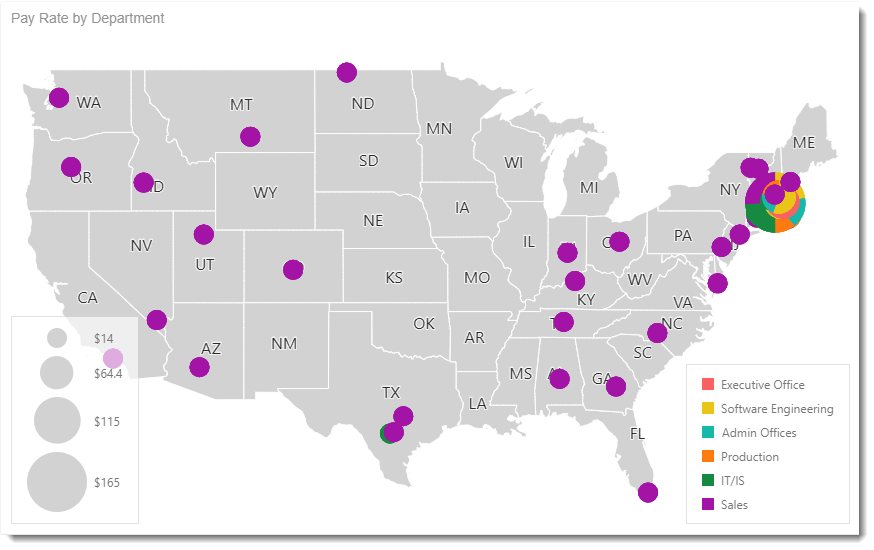
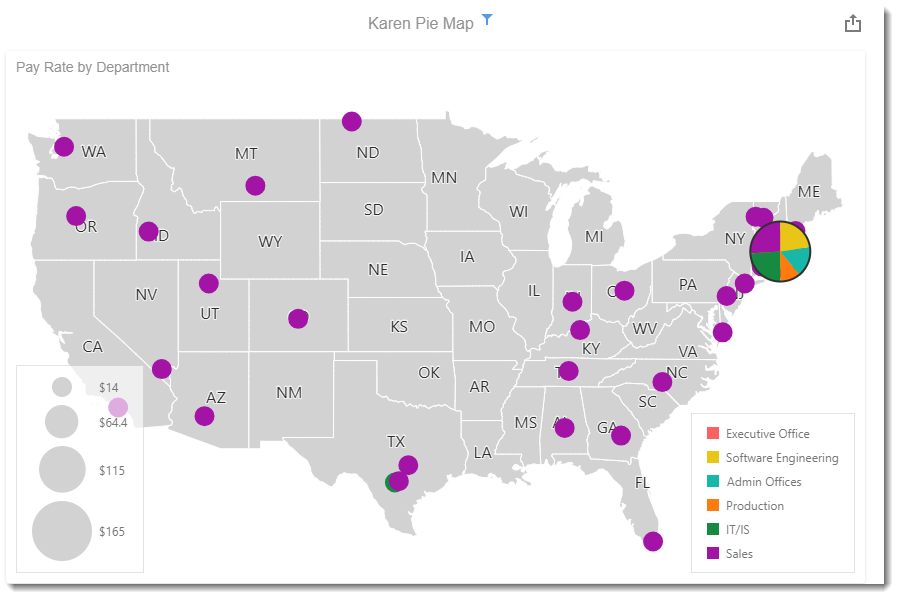
The Dataset used in this dashboard is a sample of a Human Resources data. The Dataset contains information about Age, Gender, Marital Status, Name of the employee, Department, City, etc.
I would like to find out the following from the Dashboard:
- Where were most employees from?
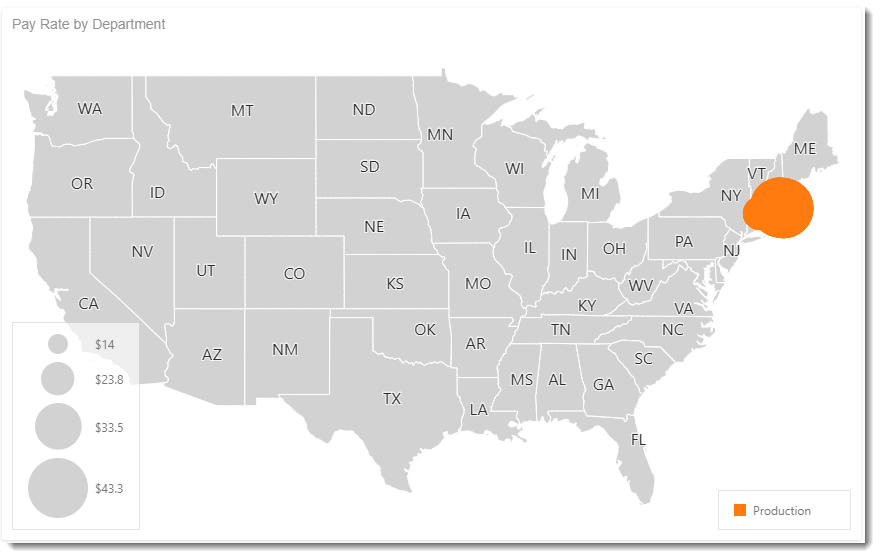
- What is the average pay rate by department?
- Which departments do they work in?
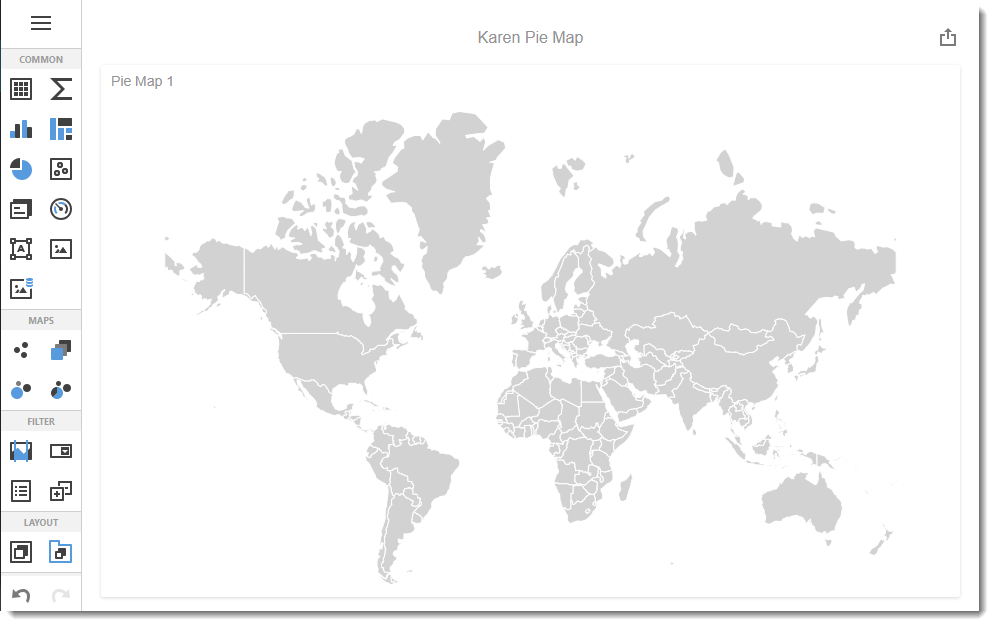
- To create this visual, begin by selecting Pie Map.
Binding Menu
- The Binding Menu allows you to create and modify the data selected for the dashboard.
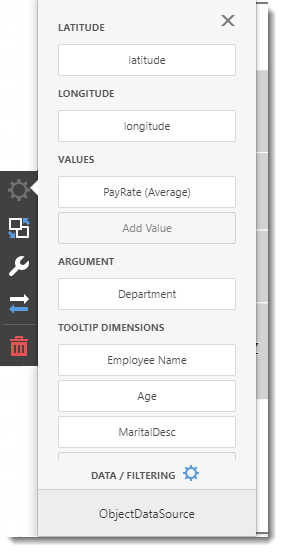
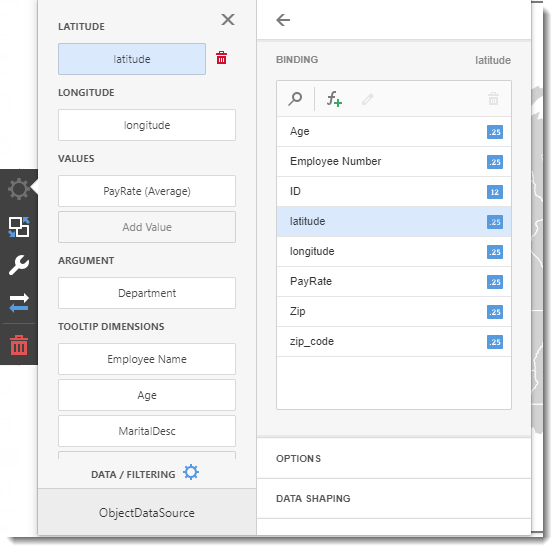
Latitude
- The latitude section is where you set the latitude for your map.
Binding
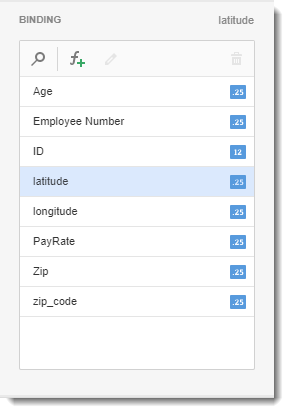
- Select the value for the information you are going to show.
For the example above I am going to show the Latitude.
- You may need to use a calculated field. To create a calculated field use the F+ button. You will need to use SQL Queries for this.
Please seek assistance from your IT department as we do not provide SQL Query support.
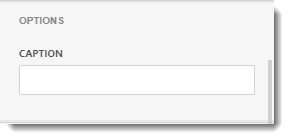
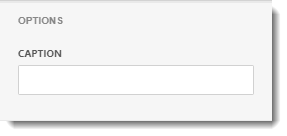
Options
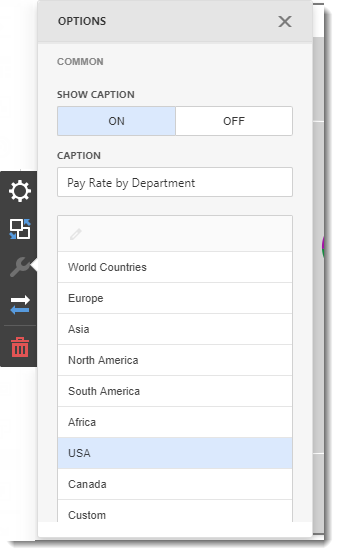
- Caption: This is the heading for the selected latitude. It is best to caption the visual with a variation of the question asked at the beginning of creating the dashboard.
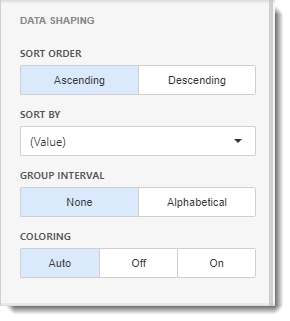
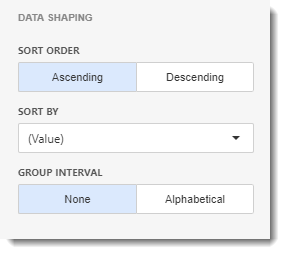
Data Shaping
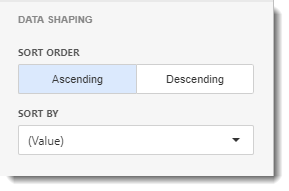
- In this section, you can change the sort order of the value.
- Sort Order: You can select Ascending or Descending sort order.
- Sort By: Select the value you want to sort this data.
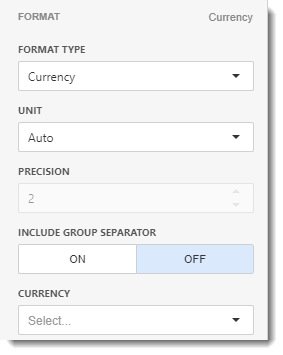
Format
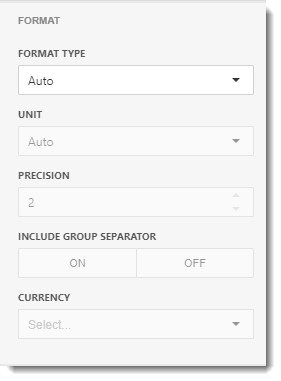
- In this section, you have the option to select the format type and unit to the value.
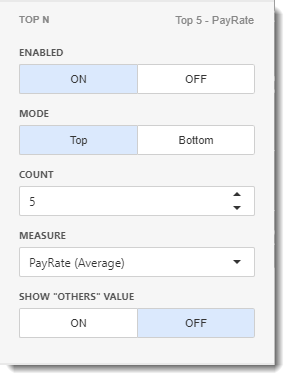
Top N
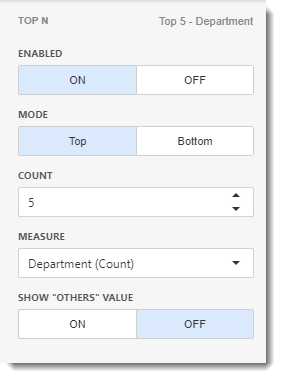
- In this section, you can customize the display number of values that correspond to the highest or lowest values of a particular measure.
- Enable this option by clicking ON.
- Mode: Specifies whether top or bottom values should be displayed.
- Count: The number of Values you want to display.
- Measure: The measure selected which the top or bottom values will be determined.
- Show "Others" Value: If enabled, all values that are not shown in the top/bottom ones will be displayed in the "Others" value.
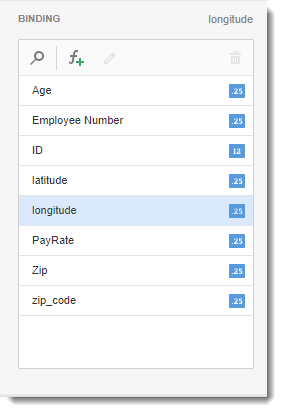
Longitude
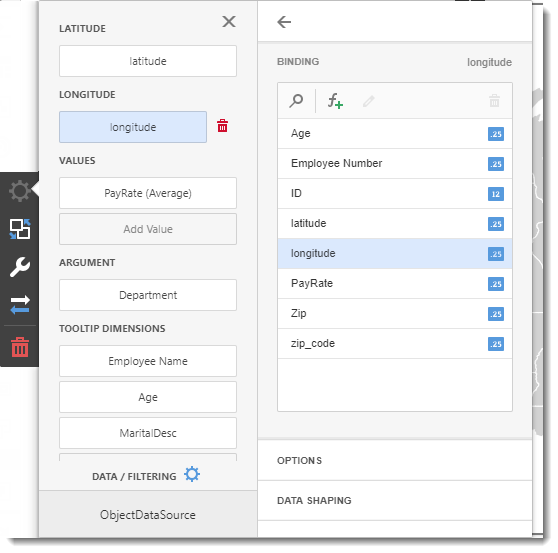
- Longitude section is where you set the longitude of your map.
Binding
- Select the value for the information you are going to show.
For the example above I am going to show the Longitude.
- You may need to use a calculated field. To create a calculated field use the F+ button. You will need to use SQL Queries for this.
Please seek assistance from your IT department as we do not provide SQL Query support.
Options
- Caption: This is the heading for the selected Longitude. It is best to caption the visual with a variation of the question asked at the beginning of creating the dashboard.
Data Shaping
- In this section, you can change the sort order of the value.
- Sort Order: You can select Ascending or Descending sort order.
- Sort By: Select the value you want to sort this data.
Format
- In this section, you have the option to select the format type and unit to the value.
Top N
- In this section, you can customize the display number of values that correspond to the highest or lowest values of a particular measure.
- Enable this option by clicking ON.
- Mode: Specifies whether top or bottom values should be displayed.
- Count: The number of Values you want to display.
- Measure: The measure selected which the top or bottom values will be determined.
- Show "Others" Value: If enabled, all values that are not shown in the top/bottom ones will be displayed in the "Others" value.
Values
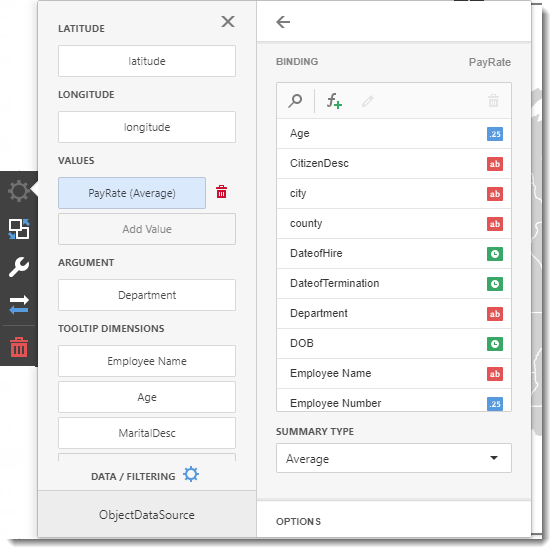
The values section contains data to evaluate the pie values.
Binding
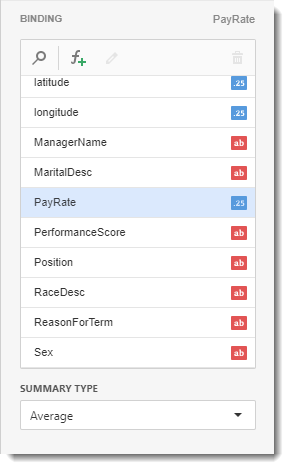
- Select the value for the information you are going to show.
For the example above I am going to show the Pay Rate.
- You may need to use a calculated field. To create a calculated field use the F+ button. You will need to use SQL Queries for this.
Please seek assistance from your IT department as we do not provide SQL Query support.
- Summary Type: Select which type of summary variable you would like.
Options
- Caption: This is the heading for the Value selected. It is best to caption the visual with a variation of the question asked at the beginning of creating the dashboard.
Format
- In this section, you have the option to select the format type and unit to the value.
Argument
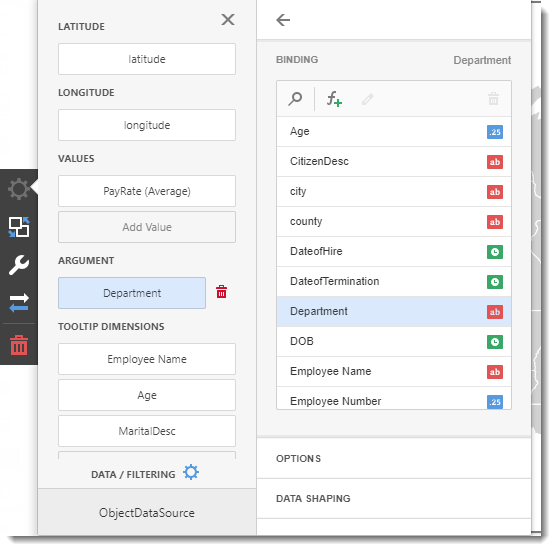
Arguments section contains data items that provide values used to label pie segments.
Binding
- Select the value for the information you are going to show.
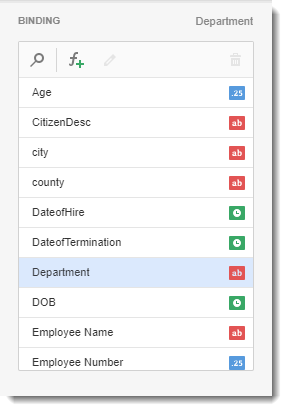
For the example above I am going to show the Department.
- You may need to use a calculated field. To create a calculated field use the F+ button. You will need to use SQL Queries for this.
Please seek assistance from your IT department as we do not provide SQL Query support.
Options
- Caption: This is the heading for the Argument selected. It is best to caption the visual with a variation of the question asked at the beginning of creating the dashboard.
Data Shaping
- In this section, you can change the sort order of the value and enable or disable the coloring.
- Sort Order: You can select Ascending or Descending sort order.
- Sort By: Select the value you want to sort this data.
- Group Interval: You can set group intervals by alphabetical or none.
- Coloring: You can set the coloring options to Automatic, Off, and customize the color by selecting On.
Top N
- In this section, you can customize the display number of values that correspond to the highest or lowest values of a particular measure.
- Enable this option by clicking ON.
- Mode: Specifies whether top or bottom values should be displayed.
- Count: The number of Values you want to display.
- Measure: The measure selected which the top or bottom values will be determined.
- Show "Others" Value: If enabled, all values that are not shown in the top/bottom ones will be displayed in the "Others" value.
Tooltip Dimensions/Tooltip Measures
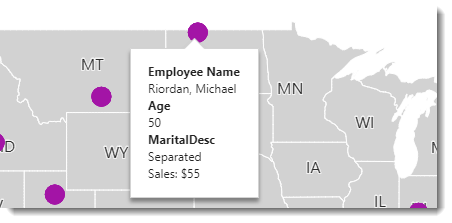
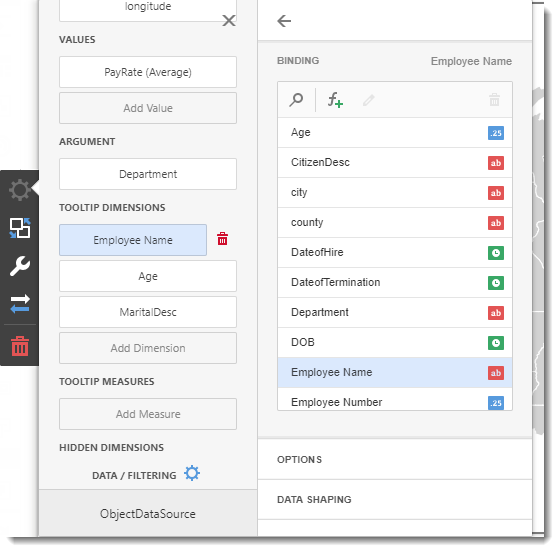
- In the Tooltip Dimensions/Tooltip Measure sections contains values that will be displayed in the tooltips of the visual.
Binding
- Select the value for the information you are going to show.
For the example above I am going to show the Employee Name.
- You may need to use a calculated field. To create a calculated field use the F+ button. You will need to use SQL Queries for this.
Please seek assistance from your IT department as we do not provide SQL Query support.
Options
- Caption: This is the heading for the Tooltip selected. It is best to caption the visual with a variation of the question asked at the beginning of creating the dashboard.
Data Shaping
- In this section, you can change the sort order of the value.
- Sort Order: You can select Ascending or Descending sort order.
- Sort By: Select the value you want to sort this data.
- Group Interval: You can set group intervals by alphabetical or none.
Top N
- In this section, you can customize the display number of values that correspond to the highest or lowest values of a particular measure.
- Enable this option by clicking ON.
- Mode: Specifies whether top or bottom values should be displayed.
- Count: The number of Values you want to display.
- Measure: The measure selected which the top or bottom values will be determined.
- Show "Others" Value: If enabled, all values that are not shown in the top/bottom ones will be displayed in the "Others" value.
Hidden Dimensions/Hidden Measures
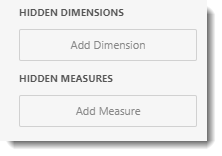
- This section is used to utilize a field without displaying in the dashboard item. Adding the Hidden dimension or measure, you can sort any values in the data by that specific dimension/measure.
- This section is to sort or filter the visual dashboard in order to get more detailed analysis.
- You can use Hidden Dimensions/ Hidden Measures with the following sections:
- Data/Filtering
- Data Shaping
- Common
- Top N
If the value is already added in the binding menu, you don't need to add it in the Hidden Dimensions/Measures.
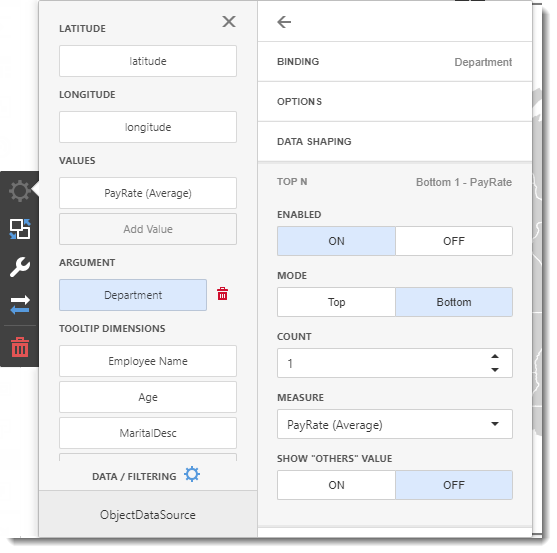
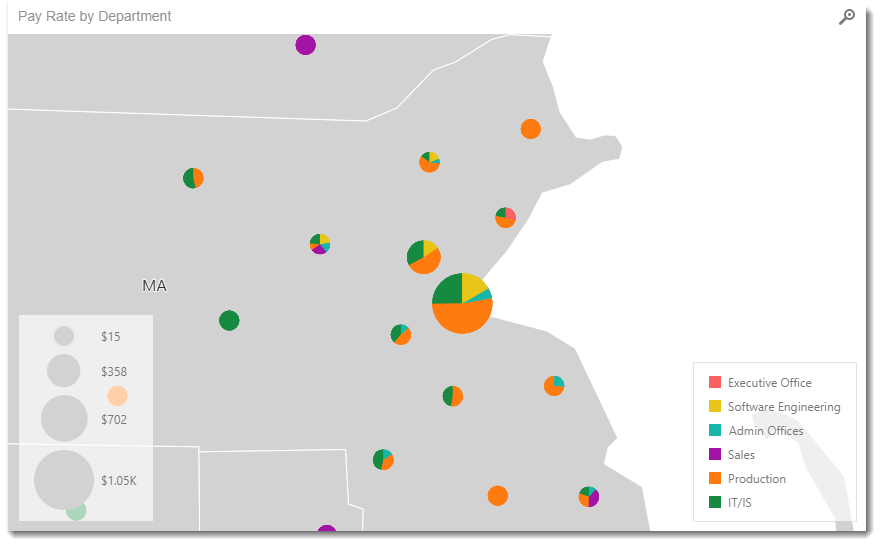
In this example, we want to filter the employees with the lowest pay rate.
- After the data is added in the Hidden Measure, select the argument and/or values you want to filter.
In this case, I want to look the employees with the lowest pay rate. Select Argument and click Top N. In Top N, enable this option and change the mode to Bottom. In count write down the number and in measure select Pay Rate.
Interactivity Menu
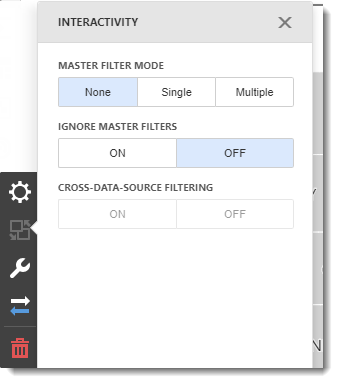
- The interactivity features enables interaction between several variable in the Pie Map.
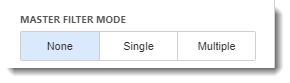
Master Filter Mode
- This mode allows you to use any data aware item ad a filter for other dashboard items.
- None: Disables master filtering.
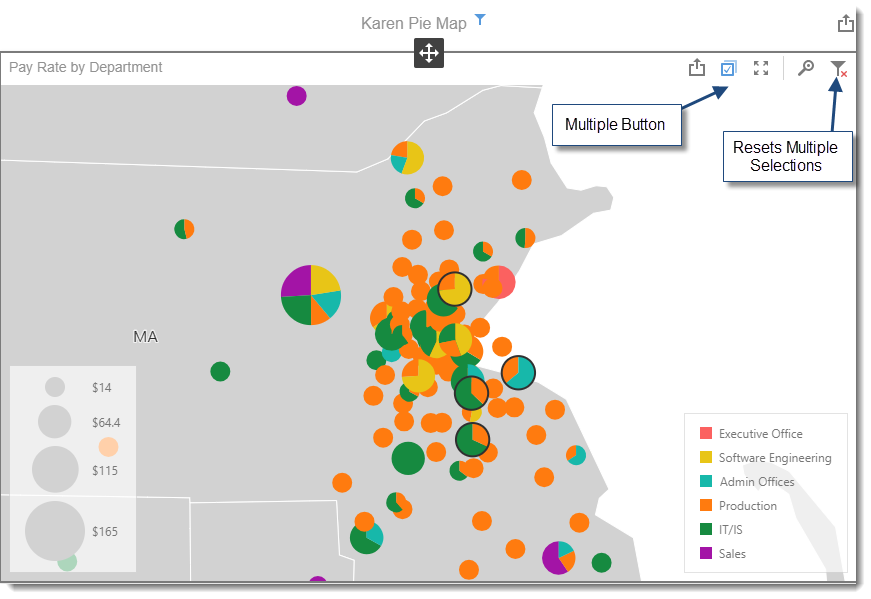
- Single: Allows you to select only one element in the Master Filter item. When this mode is enabled, the default selection will be set to a Master Filter element. You can change this selection, but cannot clear it.
- Multiple: Allows you to select multiple elements in the Master Filter item. To reset filtering, use the Reset Multiple Selections button in the Pie Map.
Ignore Master Filters
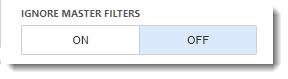
- You have the option to enable or disable Master Filters.
Cross-Data-Source Filtering
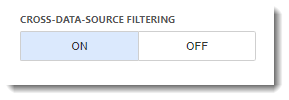
- In this mode, when different items in a dashboard are bound to different data sources, you can specify that a particular Master Filter should be applied across data sources. This means that it will apply filtering to fields with matching names in all data sources.
Options Menu
Common
- Show Caption: You can enable or disable the visual caption.
- Caption: This is the heading for the visual selected. It is best to caption the visual with a variation of the question asked at the beginning of creating the dashboard.
- Style: Select the map style.
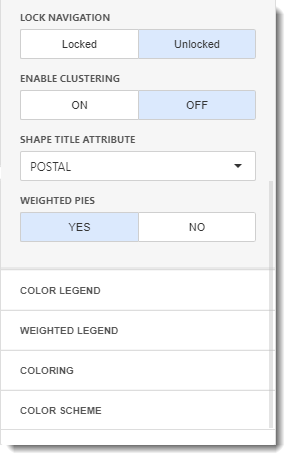
- Lock Navigation: You can zoom and scroll the map by enabling this option.
- Enable Clustering: Enabling this option, you can group the tooltips that are close into a big bubble.
- Shape Title Attribute: You can select the title attributes to be displayed in the map.
- Weighted Pies: You can count the weight of the pies.
Color Legend
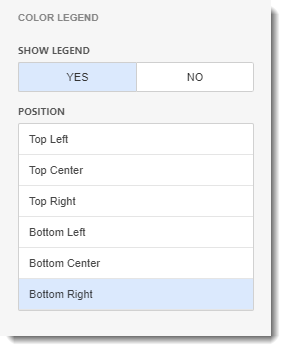
- Show Legend: You have the option to show legend in the map.
- Position: Select the position for the legends.
Weighted Legend
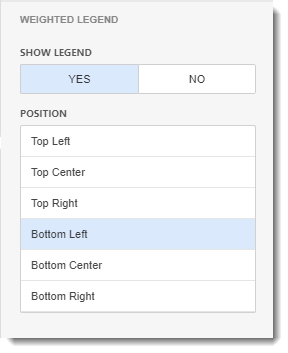
- Show Legend: You have the option to show weighted legend in the map.
- Position: Select the position for the weighted legends.
Coloring
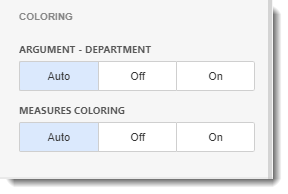
- You can change or enable colors to the arguments, series, and measure coloring in the Pie Map. You can change the default palette used to color Pie tiles. For this, go to Color Scheme section.
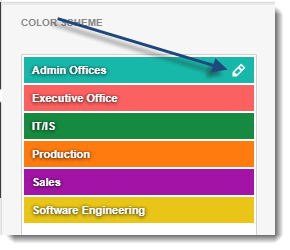
Color Scheme
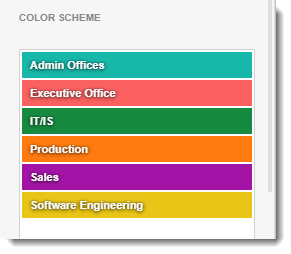
- In order to change the color to each argument click on the edit button next to the argument.
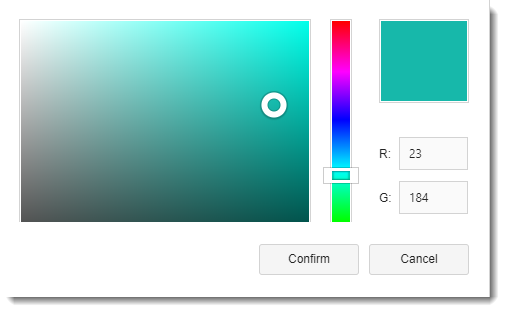
- Select the color you want and click Confirm to change the color.
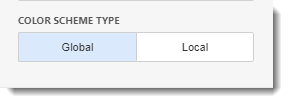
- Color Scheme Type
- Global: This color scheme provides consistent colors for identical values across the dashboard.
- Local: This color scheme provides an independent set of colors for each dashboard item.
Convert To Menu
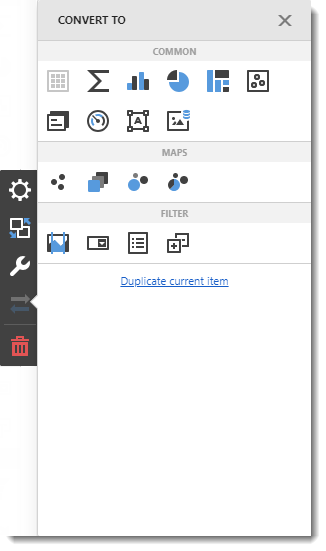
- In this section, you have the option to convert or duplicate the current dashboard item.
Remove Button

- Click on the remove button to delete the current dashboard item.