Dashboard - Groups
When creating a dashboard item it is important to know what you want to display. We recommend having some questions in mind of what you want the dashboard to show before you start creating it.
The Dataset used in this dashboard is a sample of a Human Resources data. The Dataset contains information about Age, Gender, Marital Status, Name of the employee, Department, City, etc.
I would like to find out the following from the Dashboard:
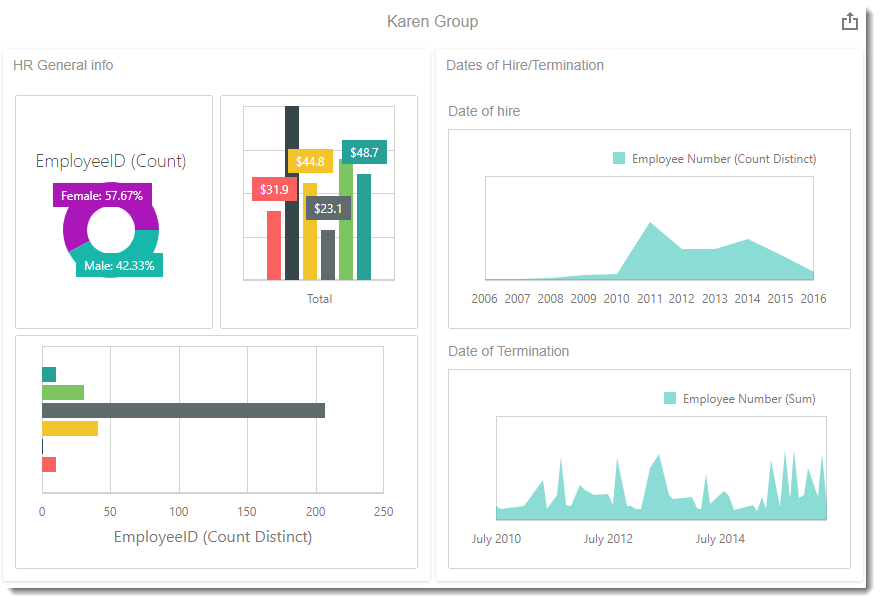
In HR General info group:
- What is the average pay rate by department?
- How many employees by department does the company have?
In Dates of Hire/Termination group:
- What are the hiring date of the employees?
- What are the dates of termination?
- To create this visual, begin by selecting Group.
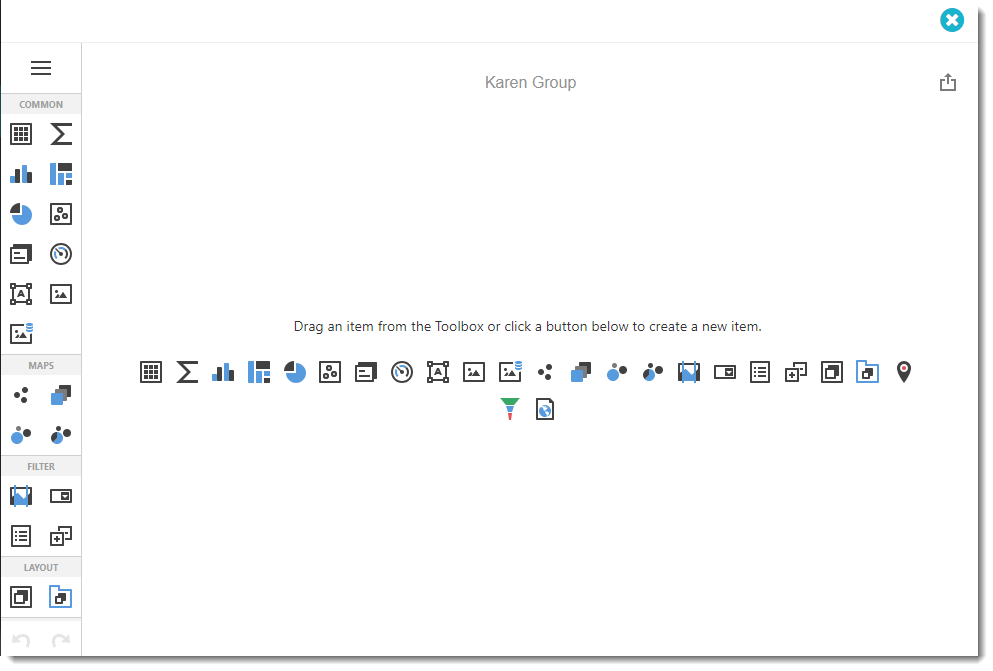
- The Group visual is to layout dashboards items by categories.
- After you selected Group you may add as many dashboards visual as you like.
Interactivity Menu
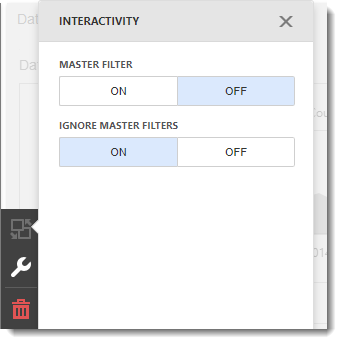
- Master Filter: This options allows you to use any data aware item ad a filter for other dashboard items.
- Ignore Master Filters: You have the option to enable or disable Master Filters.
Options Menu
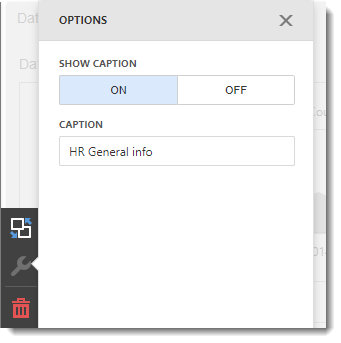
- Show Caption: You can enable or disable the visual caption.
- Caption: This is the heading for the visual selected. It is best to caption the visual with a variation of the question asked at the beginning of creating the dashboard.
Remove Button

- Click on the remove button to delete the current dashboard item.