Dashboard - Choropleth Map
When creating a dashboard item it is important to know what you want to display. We recommend having some questions in mind of what you want the dashboard to show before you start creating it.
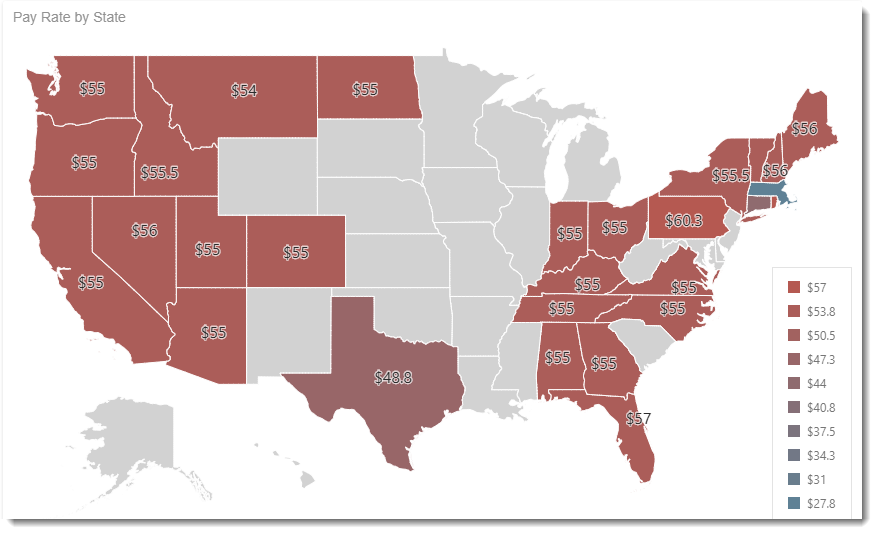
The Dataset used in this dashboard is a sample of a Human Resources data. The Dataset contains information about Age, Gender, Marital Status, Name of the employee, Department, City, etc.
I would like to find out the following from the Dashboard:
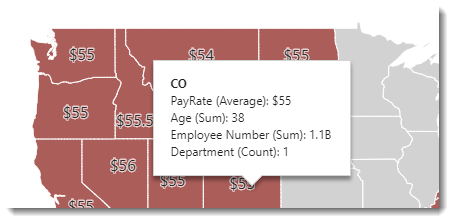
- Where are most employees from?
- What's the average pay rate?
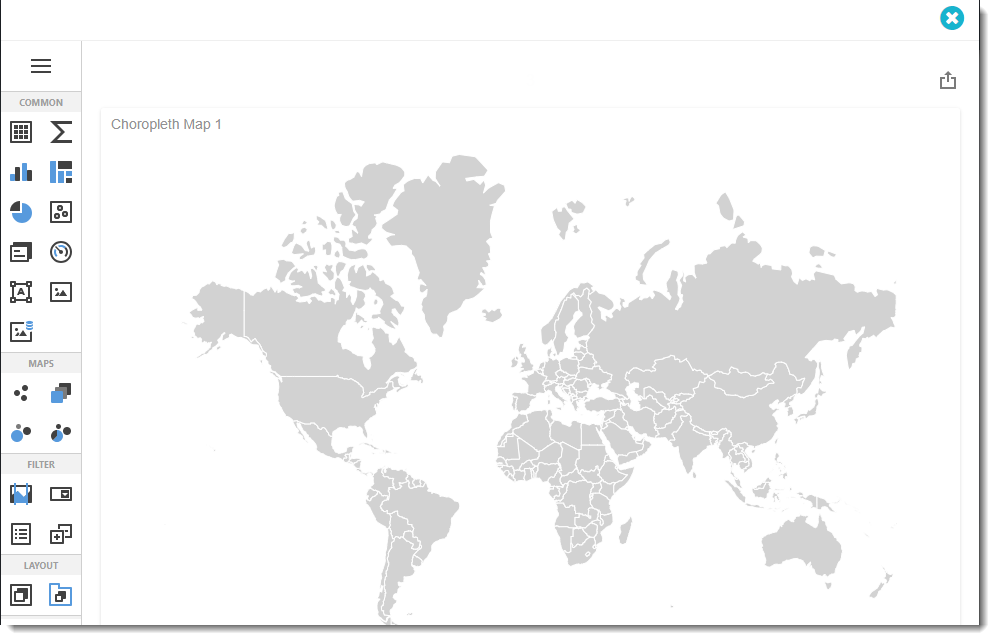
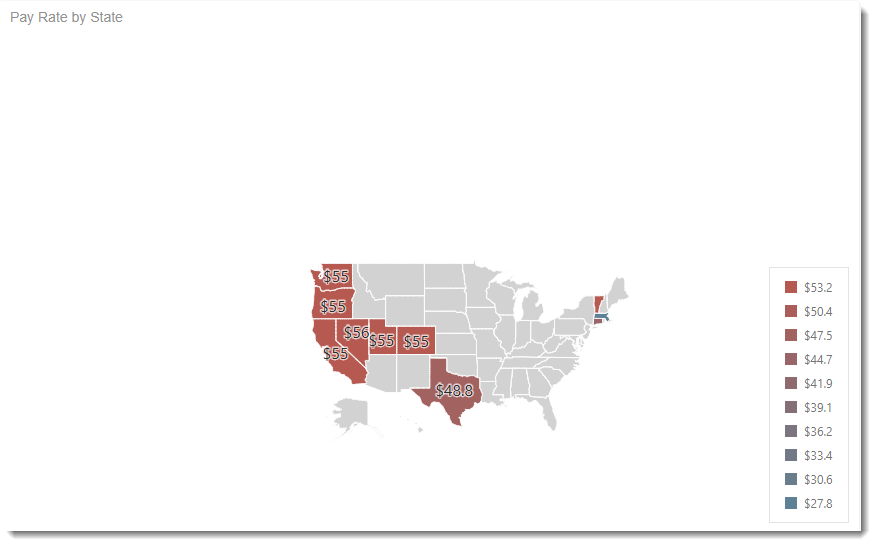
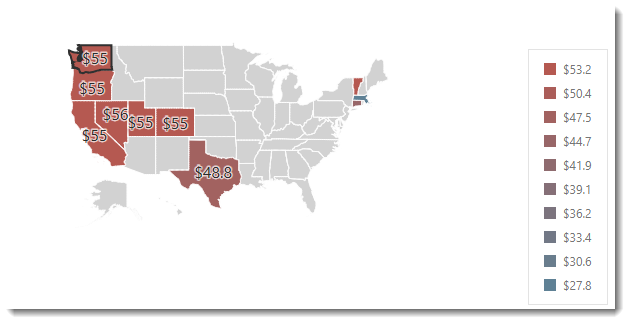
- To create this visual, begin by selecting Choropleth Map.
Binding Menu
- The Binding Menu allows you to create and modify the data selected for the dashboard.
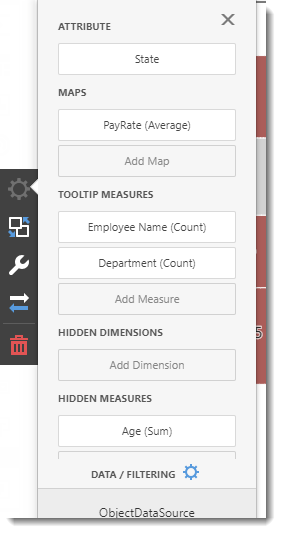
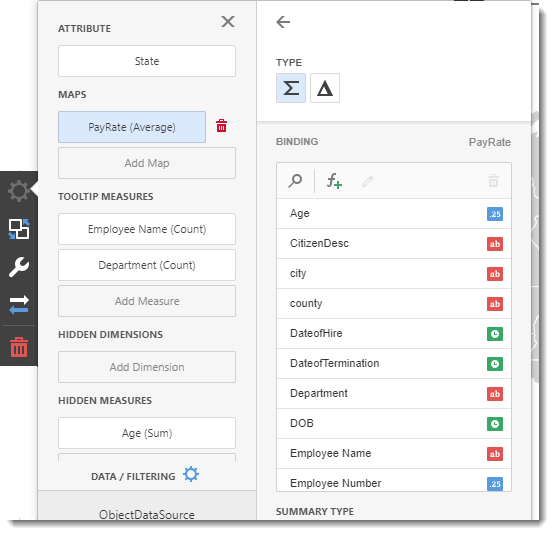
Attribute
The Attribute section contains data that will be associated with the map attributes.
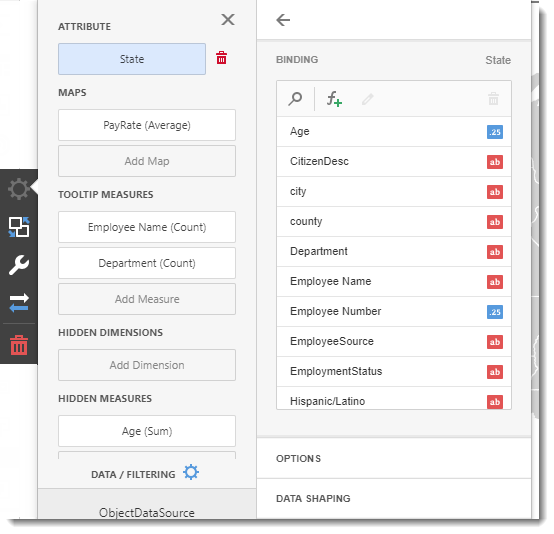
Binding
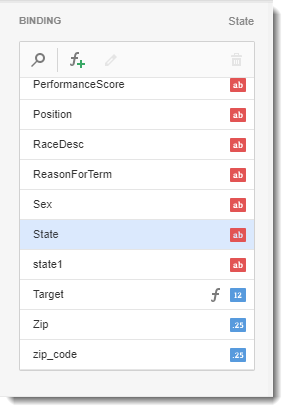
- Select the value for the information you are going to show.
For the example above I am going to show the State.
- You may need to use a calculated field. To create a calculated field use the F+ button. You will need to use SQL Queries for this.
Please seek assistance from your IT department as we do not provide SQL Query support.
Options
- Caption: This is the heading for the selected attribute. It is best to caption the visual with a variation of the question asked at the beginning of creating the dashboard.
Data Shaping
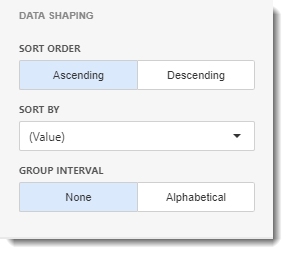
- In this section, you can change the sort order of the value.
- Sort Order: You can select Ascending or Descending sort order.
- Sort By: Select the measure you want to sort this data.
- Group Interval: You may sort group interval by Alphabetical order.
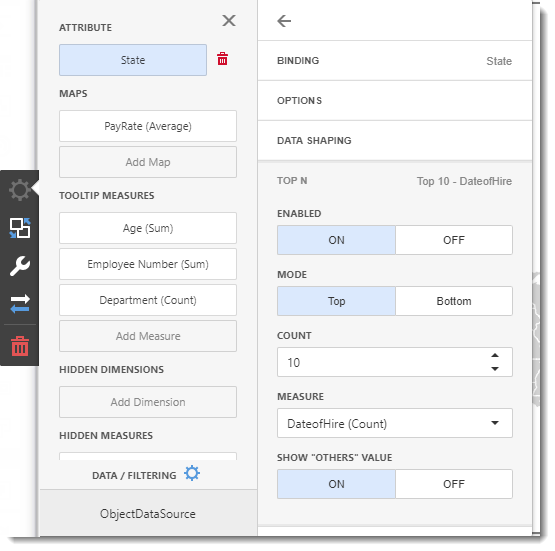
Top N
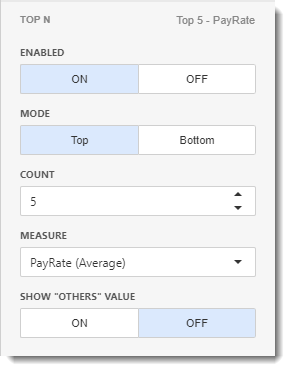
- In this section, you can customize the display number of values that correspond to the highest or lowest values of a particular measure.
- Enable this option by clicking ON.
- Mode: Specifies whether top or bottom values should be displayed.
- Count: The number of Values you want to display.
- Measure: The measure selected which the top or bottom values will be determined.
- Show "Others" Value: If enabled, all values that are not shown in the top/bottom ones will be displayed in the "Others" value.
Maps
The maps section contains values to color map shapes. Depending on the type of map, the colors and map section varies.
Value Map
The value map only calculates one variable.
Binding
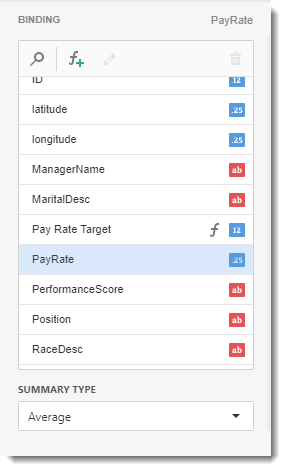
- Select the value for the information you are going to show.
For the example above I am going to show the Pay Rate.
- You may need to use a calculated field. To create a calculated field use the F+ button. You will need to use SQL Queries for this.
Please seek assistance from your IT department as we do not provide SQL Query support.
- Summary Type: Select which type of summary variable you would like.
Options
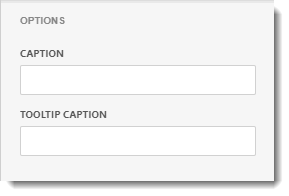
- Caption: This is the heading for the maps selected. It is best to caption the visual with a variation of the question asked at the beginning of creating the dashboard.
- Tooltip Caption: This is the heading for the tooltip selected. It is best to caption the visual with a variation of the question asked at the beginning of creating the dashboard.
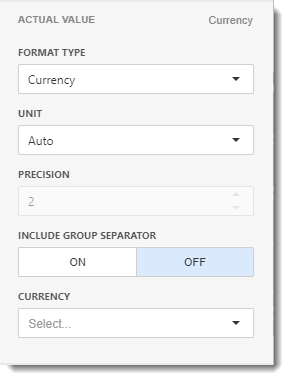
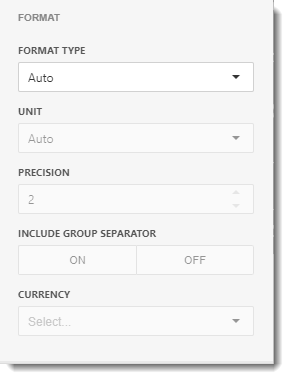
Format
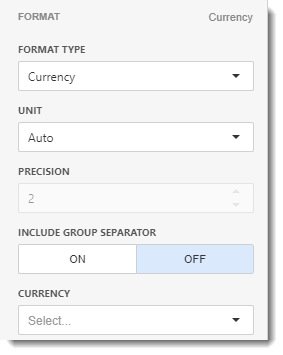
- In this section, you have the option to select the format type and unit to the value.
Delta Map
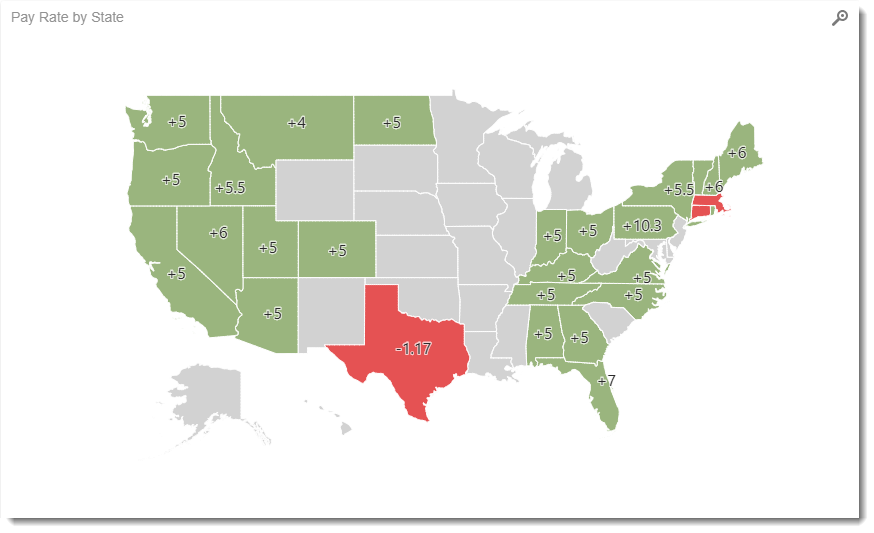
The delta map calculates the difference between two variable. You can add target in order to show differences between actual and Target values.
Target Values is optional.
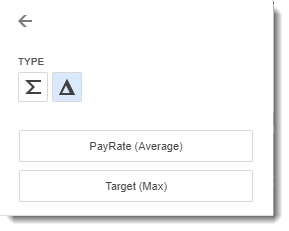
- In every Actual and Target value the following section will appear:
Actual
Binding
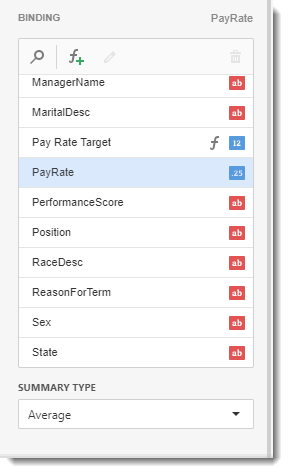
- Select the value for the information you are going to show.
For the example above I am going to show the Pay Rate.
- You may need to use a calculated field. To create a calculated field use the F+ button. You will need to use SQL Queries for this.
Please seek assistance from your IT department as we do not provide SQL Query support.
- Summary Type: Select which type of summary variable you would like.
Format
- In this section, you have the option to select the format type and unit to the value.
Target
Binding
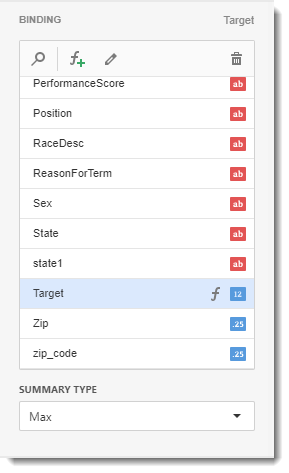
- Select the value for the information you are going to show.
For the example above I am going to show the Target.
- You may need to use a calculated field. To create a calculated field use the F+ button. You will need to use SQL Queries for this.
Please seek assistance from your IT department as we do not provide SQL Query support.
- Summary Type: Select which type of summary variable you would like.
Format
- In this section, you have the option to select the format type and unit to the value.
Options
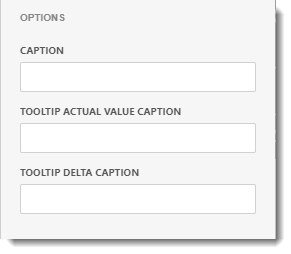
- Caption: This is the heading for the maps selected. It is best to caption the visual with a variation of the question asked at the beginning of creating the dashboard.
- Tooltip Actual Value Caption: This is the heading for the actual value selected in the tooltip. It is best to caption the visual with a variation of the question asked at the beginning of creating the dashboard.
- Tooltip Delta Caption: This is the heading for the target selected in the tooltip. It is best to caption the visual with a variation of the question asked at the beginning of creating the dashboard.
Delta Options
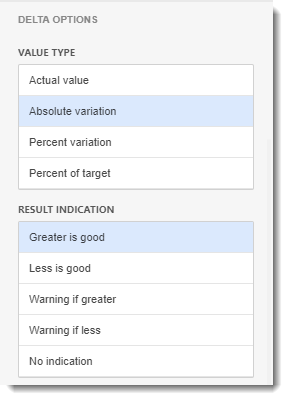
- Value Type: You can select which value should be displayed in the map.
- Result Indication: You can select the result type of the delta.
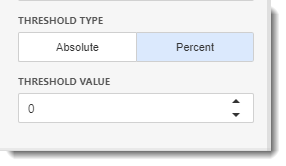
- Threshold type: The threshold is the neutral value of the delta column. You can set it up by Absolute or Percent value.
- Threshold Value: Set up the neutral value here.
Format Options
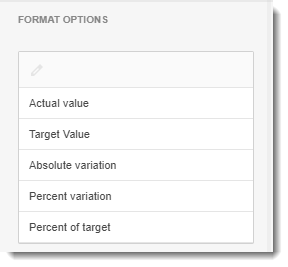
- You can change the format settings of each options here.
- Select the value and then click on the edit button.
Tooltip Measures
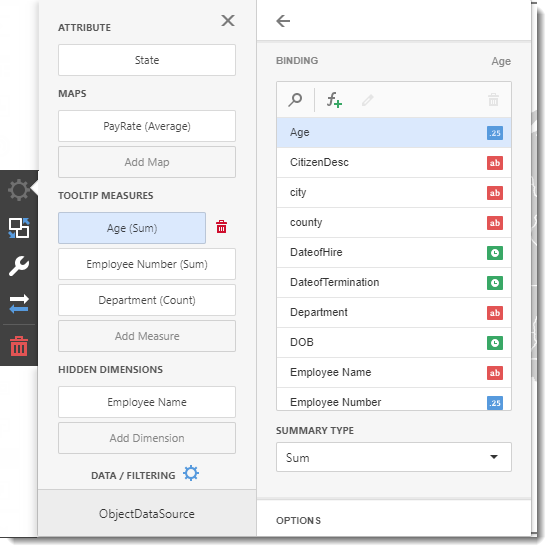
In the Tooltip Measure sections contains values that will be displayed in the tooltips of the visual.
Binding
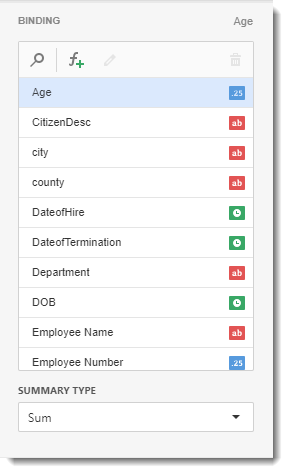
- Select the value for the information you are going to show.
For the example above I am going to show the Age.
- You may need to use a calculated field. To create a calculated field use the F+ button. You will need to use SQL Queries for this.
Please seek assistance from your IT department as we do not provide SQL Query support.
- Summary Type: Select which type of summary variable you would like.
Options
- Caption: This is the heading for the selected tooltip. It is best to caption the visual with a variation of the question asked at the beginning of creating the dashboard.
Format
- In this section, you have the option to select the format type and unit to the value.
Hidden Dimensions/Hidden Measures
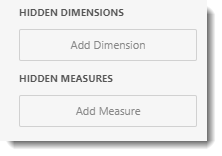
- This section is used to utilize a field without displaying in the dashboard item. Adding the Hidden dimension or measure, you can sort any values in the data by that specific dimension/measure.
- This section is to sort or filter the visual dashboard in order to get more detailed analysis.
- You can use Hidden Dimensions/ Hidden Measures with the following sections:
- Data/Filtering
- Data Shaping
- Common
- Top N
If the value is already added in the binding menu, you don't need to add it in the Hidden Dimensions/Measures.
In this example, we want to find the first 10 employees hired first.
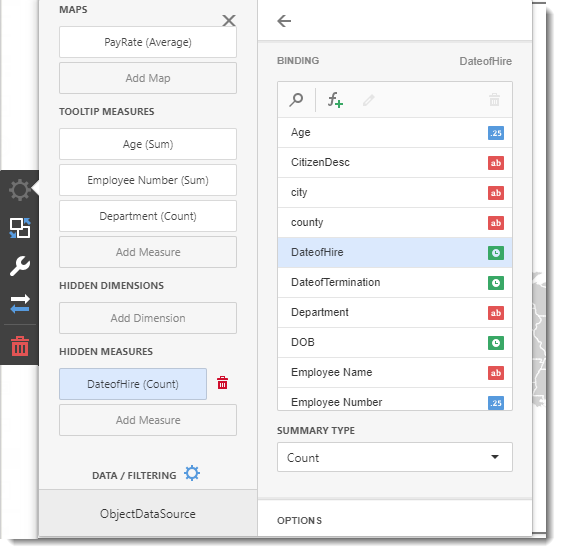
- After the data is added in the Hidden Measure, select the values you want to filter.
In this case, I want to highlight the first 10 employees hired. Select Attribute and select State and click Top N. In Top N, click ON to enable and in Count write down the amount. In Measure select Date of Hire.
Interactivity Menu
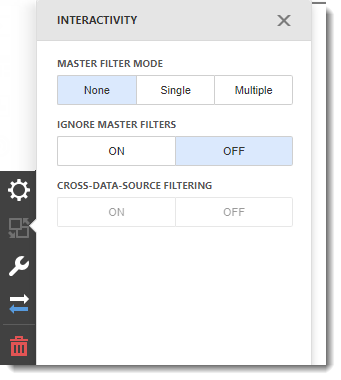
- The interactivity features enables interaction between several variable in the Choropleth Map.
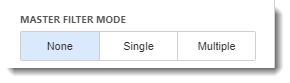
Master Filter Mode
- This mode allows you to use any data aware item ad a filter for other dashboard items.
- None: Disables master filtering.
- Single: Allows you to select only one element in the Master Filter item. When this mode is enabled, the default selection will be set to a Master Filter element. You can change this selection, but cannot clear it.
- Multiple: Allows you to select multiple elements in the Master Filter item. To reset filtering, use the Reset Multiple Selections button in the Choropleth Map.
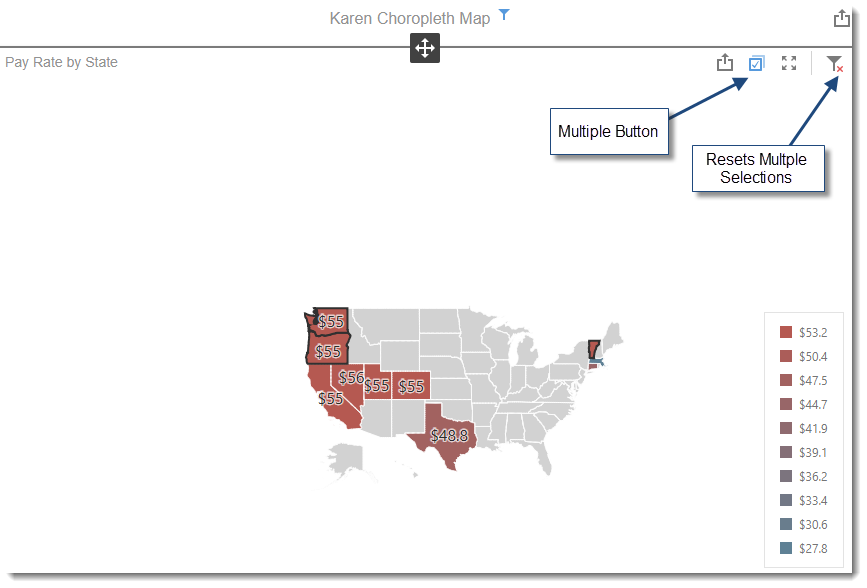
Ignore Master Filters
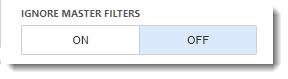
- You have the option to enable or disable Master Filters.
Cross-Data-Source Filtering
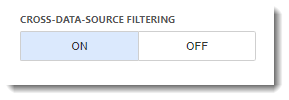
- In this mode, when different items in a dashboard are bound to different data sources, you can specify that a particular Master Filter should be applied across data sources. This means that it will apply filtering to fields with matching names in all data sources.
Options Menu
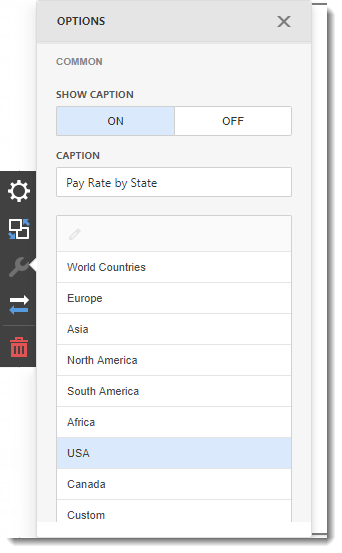
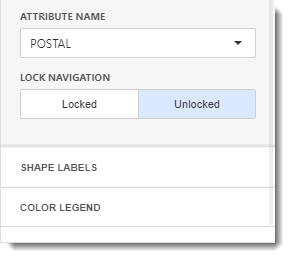
Common
- Show Caption: You can enable or disable the visual caption.
- Caption: This is the heading for the visual selected. It is best to caption the visual with a variation of the question asked at the beginning of creating the dashboard.
- Style: Select the map style.
- Attribute Name: You can select the title attributes to be displayed in the map.
- Lock Navigation: You can zoom and scroll the map by enabling this option.
Shape Labels
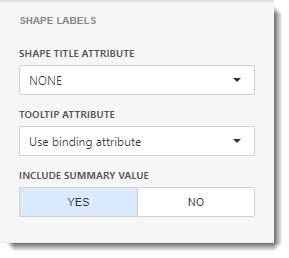
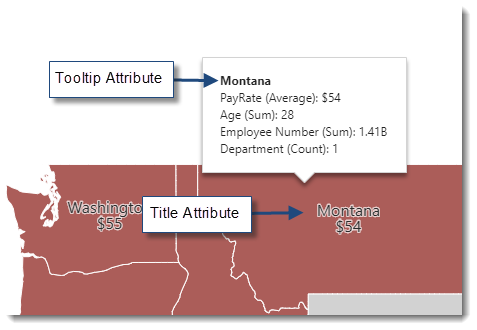
- Shape Title Attribute: Select the Attributes to display in the map.
- Tooltip Attribute: Select the attribute to be shown in the tooltip.
- Include Summary Value: You can show the value displayed in the Map section.
Color Legend
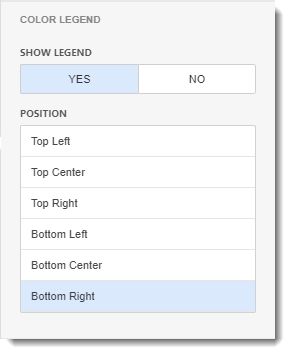
- Show Legend: You have the option to show legend in the map.
- Position: Select the position for the legends.
Convert To Menu
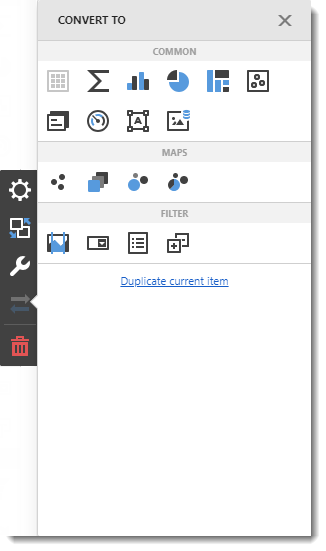
- In this section, you have the option to convert or duplicate the current dashboard item.
Remove Button

- Click on the remove button to delete the current dashboard item.