![CSS-CMYK-logo-2015-2.png]](https://go.christiansteven.com/hs-fs/hubfs/social-suggested-images/CSS-CMYK-logo-2015-2.png?height=40&name=CSS-CMYK-logo-2015-2.png)
Before You Begin
Before accessing the PBRS Dashboard, make sure:
- You have access to the PBRS Web Application.
- You can sign in using a valid PBRS user account.
- Your account has the necessary permissions to view the relevant scheduling information.
Note: The information displayed may depend on the schedules and folders accessible to your user account.
View and Understand the PBRS Dashboard
The PBRS Web Application Dashboard provides an overview of report scheduling activity, allowing users to monitor scheduled reports, review execution statistics, track report deliveries, and identify schedules that may require attention.
The Dashboard displays key scheduling information in a series of summary panels and charts, making it easier to understand the current status of the PBRS reporting environment.
Access the PBRS Dashboard
- Sign in to the PBRS Web Application.
- Select Schedules from the main navigation menu.
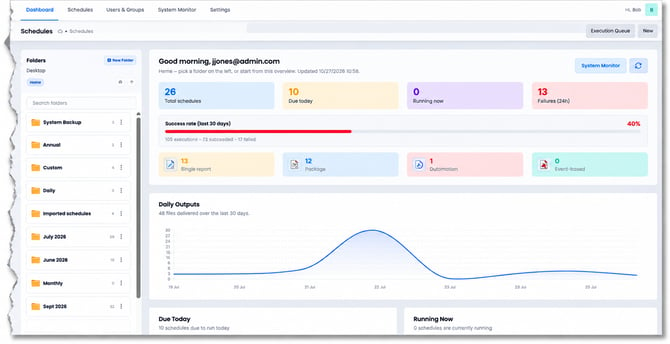
- The Schedules page opens, displaying the scheduling overview, folder navigation, and dashboard statistics.
- Review the dashboard information to monitor report scheduling activity.
Understand the Dashboard Summary
The top section of the Dashboard provides an overview of the current scheduling environment.
|
Dashboard Component |
Description |
|---|---|
|
Total schedules |
Displays the total number of schedules in the current overview. |
|
Due today |
Shows the number of schedules scheduled to execute during the current day. |
|
Running now |
Displays the number of schedules currently executing. |
|
Failures (24h) |
Shows the number of failed schedule executions recorded during the last 24 hours. |
|
Success rate (last 30 days) |
Displays the percentage of successful schedule executions over the previous 30 days. |
|
Single report |
Shows the number of single-report schedules. |
|
Package |
Shows the number of package schedules. |
|
Automation |
Shows the number of automation schedules. |
|
Event-based |
Shows the number of event-based schedules. |
Monitor Schedule Success Rate
The Success rate (last 30 days) panel provides a visual summary of schedule execution performance.
It displays the percentage of successful executions and the underlying execution counts.
In the example screenshot, the Dashboard shows:
- 105 executions recorded during the last 30 days.
- 73 successful executions.
- 17 failed executions.
- A displayed success rate of 40%.
Note: The figures shown are illustrative values from the screenshot. The displayed percentage does not reconcile with the successful and total execution counts, so it should not be used as an example calculation. Actual dashboard statistics depend on the PBRS environment and reporting period.
Review Daily Outputs
The Daily Outputs chart displays report delivery activity over the previous 30 days.
The chart helps users identify trends in report output volume, including periods of increased or reduced reporting activity.
In the example screenshot, the chart shows 48 files delivered over the last 30 days, with a noticeable increase in output activity during part of the reporting period.
This information can help administrators understand reporting demand and identify unusual changes in output activity.
Navigate Schedule Folders
The Folders panel on the left side of the Schedules page provides access to the folder structure used to organize PBRS schedules.
Users can:
- Browse the available folders.
- Select a folder to view its schedules.
- Use Search folders to locate a specific folder.
- Select New folder, where permitted, to create a folder.
- Use the available folder controls to navigate the folder structure.
Note: The folders and schedules available to each user may depend on their assigned group permissions and folder access restrictions.
Refresh Dashboard Information
The Refresh icon in the upper-right corner of the overview allows users to update the displayed scheduling information.
Select Refresh to retrieve the latest available statistics.
The System Monitor button provides access to additional monitoring information for reviewing PBRS scheduling activity.
Schedules Due Today
Review Schedules Due Today
The Schedules Due Today section of the PBRS Dashboard displays a list of report schedules expected to execute during the current day.
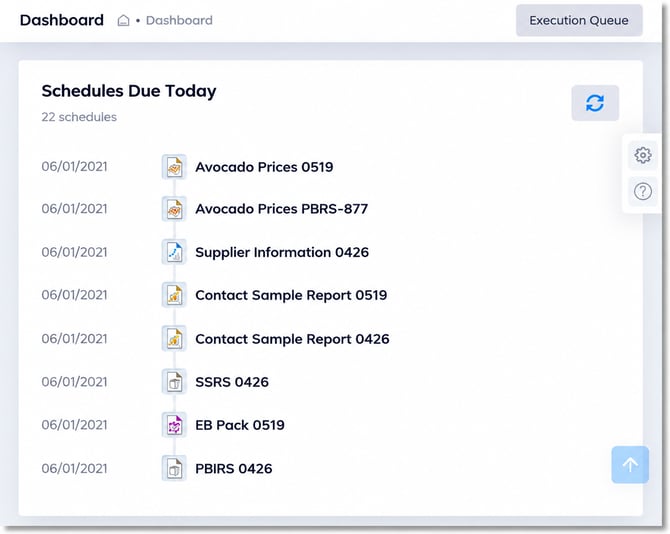
This section allows users to quickly identify upcoming scheduled reports and review the reporting workload for the day.
The screenshot displays the following information:
|
Component |
Description |
|---|---|
|
Schedules Due Today |
Displays the schedules expected to execute during the current day. |
|
Schedule Count |
Shows the total number of schedules due to run. In this example, 22 schedules are listed as due today. |
|
Scheduled Date |
Displays the date associated with each scheduled report. |
|
Schedule Name |
Identifies each schedule by its configured name. |
|
Report Type Icon |
Provides a visual indication of the report or schedule type. |
|
Refresh |
Refreshes the list to display the latest available scheduling information. |
View Schedules Due Today
- Open the PBRS Dashboard.
- Locate the Schedules Due Today section.
- Review the total number of schedules due to execute.
- Browse the list to identify individual schedules and their scheduled dates.
- Select the Refresh icon to update the displayed information.
Monitor Schedule Execution and Failures
The PBRS Dashboard provides an overview of schedule execution activity, allowing users to monitor running schedules, review execution success rates, and identify recent failures.
These statistics help administrators assess the performance of their reporting environment and identify schedules that may require attention.
The following indicators are displayed in the Dashboard:
|
Dashboard Indicator |
Description |
|---|---|
|
Running now |
Displays the number of schedules currently executing. |
|
Failures (24h) |
Shows the number of failed schedule executions recorded during the previous 24 hours. |
|
Success rate (last 30 days) |
Displays the percentage of successful schedule executions during the previous 30 days. |
|
System Monitor |
Provides access to additional information about schedule execution and system activity. |
|
Refresh |
Updates the dashboard statistics with the latest available information. |
Review Schedule Execution Activity
- Open the PBRS Dashboard.
- Review Running now to identify how many schedules are currently executing.
- Check Failures (24h) to determine whether any schedules have failed recently.
- Review Success rate (last 30 days) to assess overall execution performance.
- Select Refresh to update the displayed statistics.
- If further investigation is required, select System Monitor to review additional execution information.
Troubleshooting
The following troubleshooting steps address common issues encountered when viewing and monitoring scheduling activity through the PBRS Web Application Dashboard.
Dashboard Information Is Not Updating
Possible cause: The Dashboard has not refreshed, or the latest scheduling information is not yet available.
Resolution:
- Open the PBRS Dashboard.
- Select the Refresh icon to update the displayed statistics.
- Confirm that the PBRS Scheduler is running.
- Check whether recent schedule executions appear in System Monitor.
- Refresh the browser if the information remains unchanged.
- If the issue persists, review the PBRS Error Log for related errors.
Schedules Are Missing from the Dashboard
Possible cause: The user does not have permission to access the schedules, or the schedules are located in folders that are restricted by group permissions.
Resolution:
- Confirm that the expected schedules exist in PBRS.
- Open User Manager and locate the affected user.
- Select Schedules to review the user's assigned schedules.
- Verify that the required schedules are assigned to the user.
- Open Group Manager and review the group's Folders permissions.
- Confirm that the user has access to the folders containing the required schedules.
- Refresh the Dashboard to check whether the expected information is displayed.
Schedule Counts Do Not Match Expectations
Possible cause: The Dashboard statistics have not refreshed, or the schedules being counted differ from those expected by the user.
Resolution:
- Select Refresh to update the Dashboard.
- Review Total schedules to confirm the displayed count.
- Check Due today and Running now to identify the relevant scheduling activity.
- Review the configured schedules and their scheduling frequencies.
- Confirm that the schedules are enabled and configured to run at the expected times.
- Review System Monitor for additional execution information.
The Daily Outputs Chart Is Empty or Shows Unexpected Results
Possible cause: No report outputs were generated during the selected reporting period, or the displayed statistics have not been refreshed.
Resolution:
- Confirm that schedules have executed during the previous 30 days.
- Check System Monitor for successful report executions.
- Verify that the schedules are configured to generate report outputs.
- Select Refresh to update the Dashboard.
- Review the PBRS Error Log if reports were expected but were not generated.
Need Additional Help?
If you continue to experience issues after following the troubleshooting steps above, please contact ChristianSteven Support for further assistance.