Canvases - Reporting
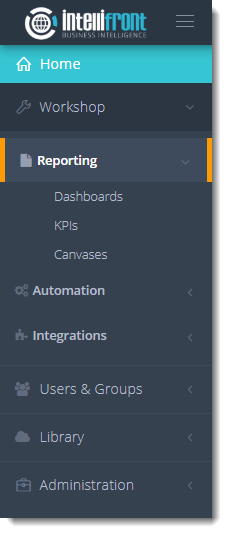
- Go to Worskshop and select Reporting. In Reporting, select Canvases.
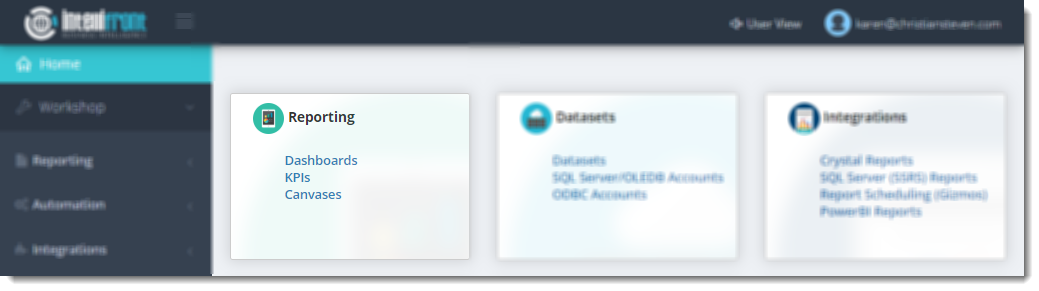
- Or select Canvases from the card on the home screen.
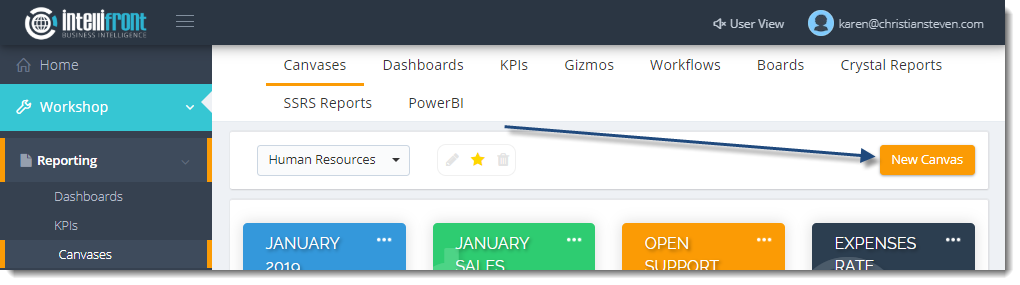
- Click New Canvas.
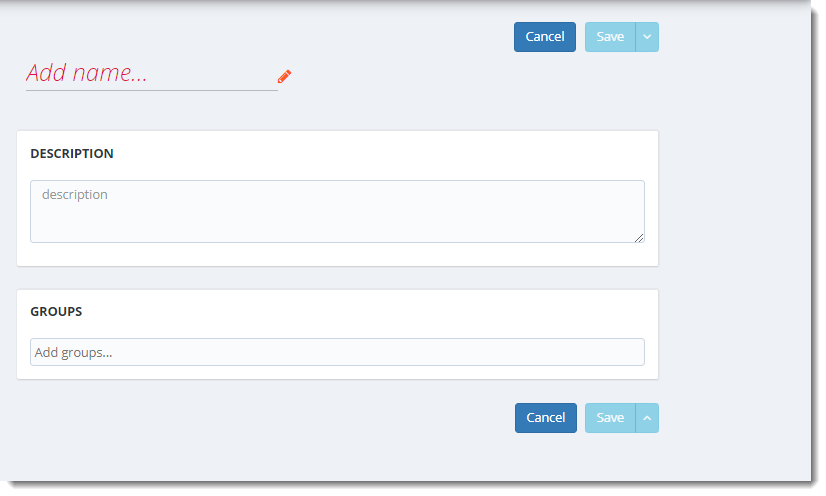
- Add Name: Give the Canvas a unique name.
- Click the checkmark next to the name to save the name and to begin creating the Canvas.
- Description: Descriptions are optional but they can be used to explain what the dashboard shows.
- Groups: Use groups to determine which groups of people have access to which dashboard.
Groups must have been set up within Users and Groups - Groups Manager
Add KPIs
- A list of available KPIs will be displayed.
- Use the search bar to search for KPIs.
- To select a KPI for a Canvas simply drag and drop the desired KPI to the right-hand side of the screen or click (+) next to the KPI.
(Maximum 4 KPIs)
Add Dashboards
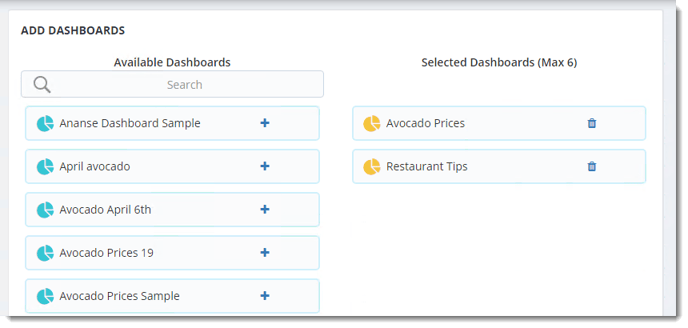
- A list of available Dashboards will also be shown.
- Use the search bar to search for Dashboards.
- Dashboards with a blue icon are creating in the Dashboard section.
- Dashboards with a yellow icon are added in the Power BI section.
- To select a Dashboard for a Canvas simply drag and drop the desired Dashboard to the right-hand side of the screen or click (+) next to the Dashboard.
(Maximum 6 Dashboards)
- To remove a chosen KPI or Dashboard click on the bin icon on each item you want to remove.
- Once the KPIs and the Dashboards have been chosen you may assign Groups to each Canvas.
- Click Save.
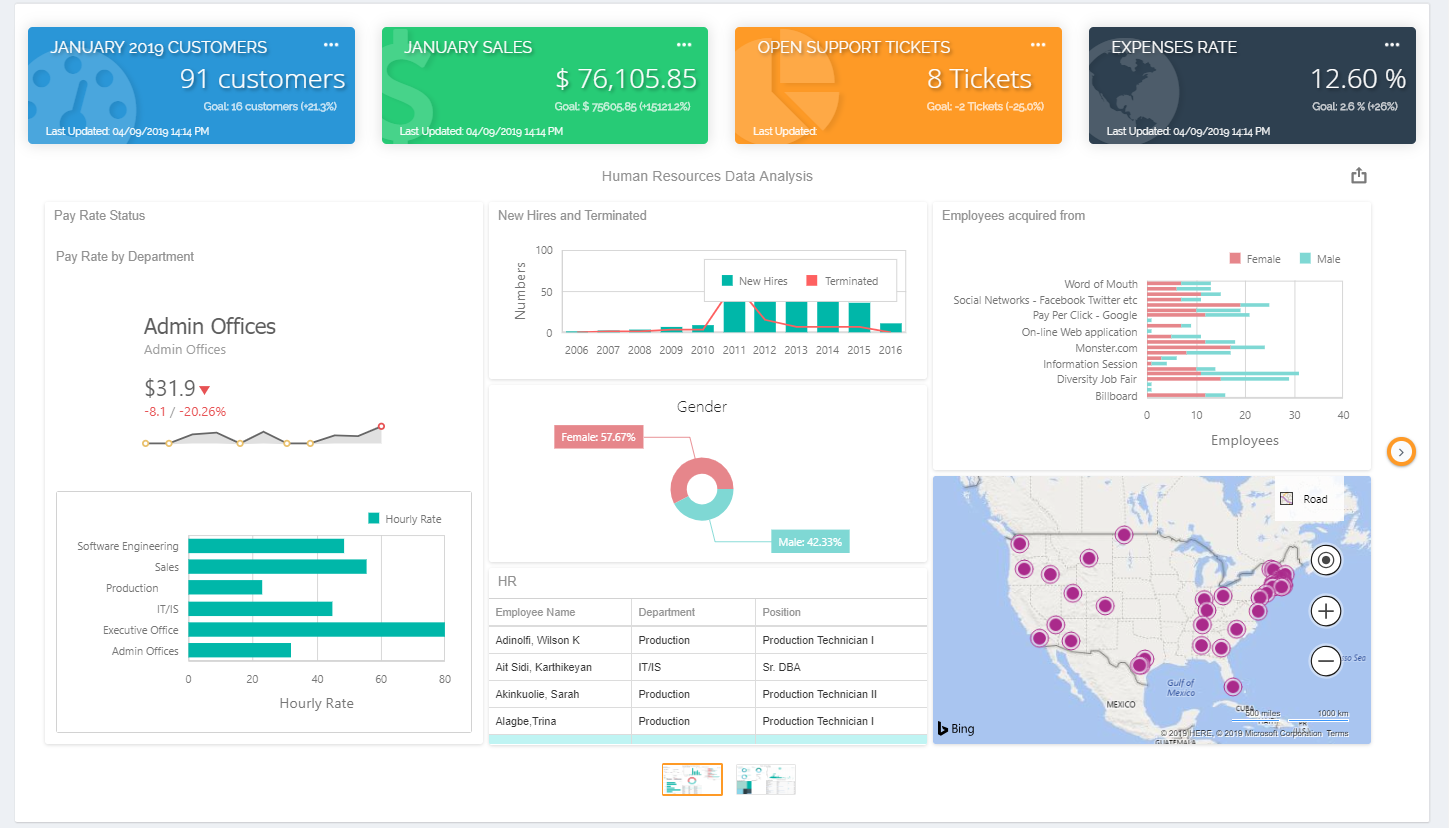
- The Canvas will be displayed on the home screen.
- If you have more than one Canvas but would like to have a particular one shown as a default use the 'Star' to make it a favorite.