System Monitor
The System Monitor is a vital tool that allows users to monitor scheduling activities, system events, and various processes within the system. It provides a comprehensive overview of the system's operation and can help users track and manage important tasks efficiently.
Step 1: Navigate to System Monitor.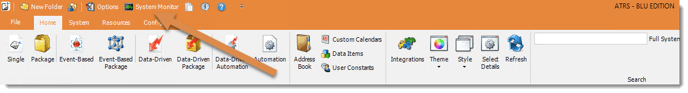
- To manage each section:
- Schedule Manager
- Email Log
- Email Queue
- Error Log
- Deferred Delivery
- Read Receipts
- History View
- Retry View
- API Execution Queue
Schedule Manager
Step 1: Navigate to System Monitor.
Step 2: Select Scheduler Manager.
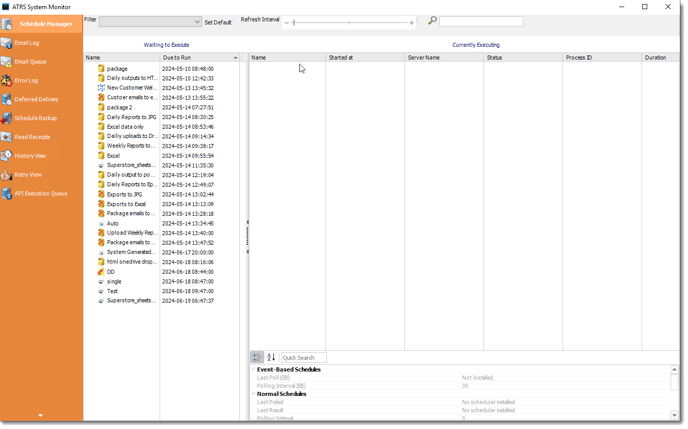
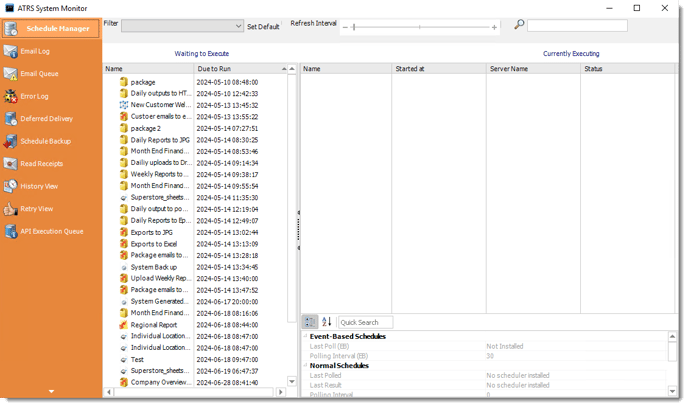
Schedule Manager in depth view:
The schedule manager will show currently executing schedules as well as any schedules scheduled to run (based on filter selected). From here you can remove a schedule from the waiting to execute or currently executing section. You can also go to the properties of a schedule by right-clicking the schedule.
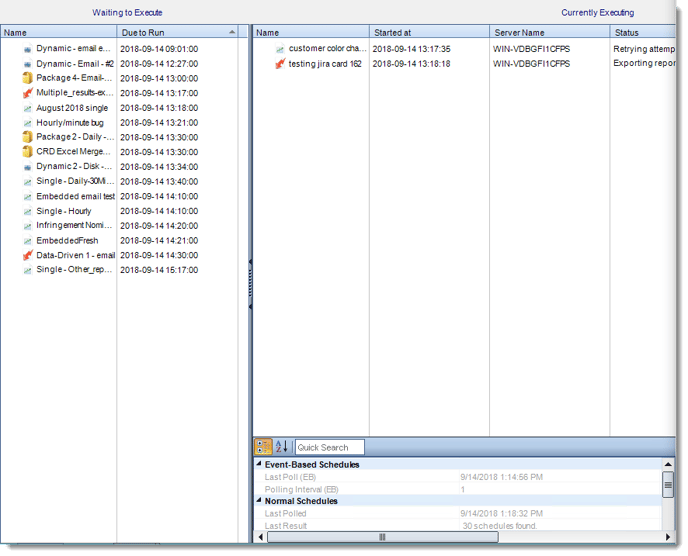
- Executing: This screen will display the schedules that are currently executing.
- Waiting in Queue: This screen will show the schedules that are waiting in the queue to be executed. You can also group the schedules by Schedule Type.
- Refreshing the Display: You can adjust the refresh interval of the schedule manager by using the Refresh Interval scroller which has a range of 2 to 60 seconds.
- Managing Processes: The Schedule manager also displays the Process ID which you can use to identify matching processes in the Windows Task Manager.
Context Menu
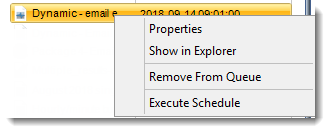
- Properties: Select the schedule, right-click and select "Open Schedule properties". This opens the schedule properties.
- Show in Explorer: Select the schedule, right-click and select "Show the schedule in Explorer. This shows the schedule in the CRD Explorer.
- Remove From Queue: Select the schedule, right-click and select "Remove from Queue". The schedule is removed from the queue.
- Execute Schedule: Select the schedule, right-click and select "Execute Schedule". The schedule is executed right away if it was waiting
Email Log
The email log displays a comprehensive list of successfully delivered emails. Users can easily access individual emails by double-clicking on them, opening them in their email client. Additionally, users can efficiently search for specific emails using the search field provided.
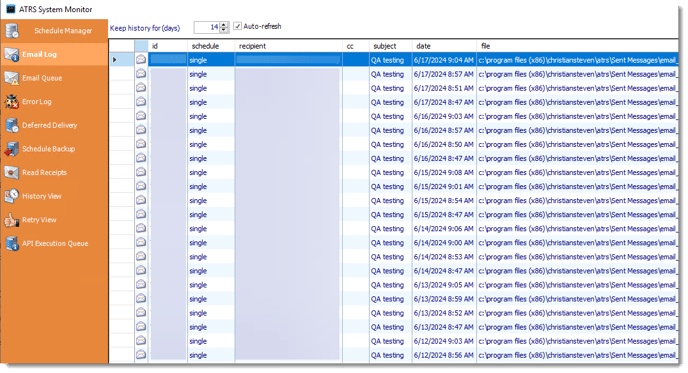
This functionality works for emails sent by SMTP. For Exchange or Office 365 setups, successful emails will be shown in the "Sent Items" folder of the email account that was used to send the email
Email Queue
This section displays a list of emails that have failed to send. If the "Resend Failed Emails" option is enabled in the settings, CRD will continuously attempt to resend the email until it is manually removed from the queue. For instance, if there is a typo in the email address (e.g., .cmo instead of .com), the queue will indicate the timestamp of the last delivery attempt and its outcome.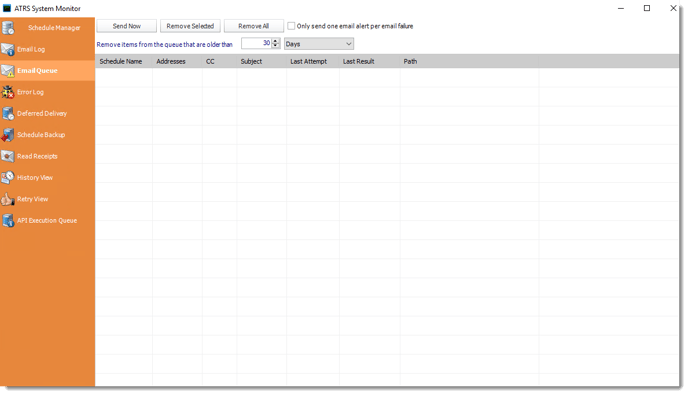
This screen shows a list of all failed emails. If "Resend Failed Emails" has been checked in Options, then CRD will keep retrying the email until it is manually removed from the queue. An example would be if an email address has been misspelled (.cmo instead of .com). The queue will show when the last attempt was, and what the result was.
- Send Now: Select a message, and click this button to attempt an immediate delivery.
- Remove Selected: Select a message and click on this button to delete it from the list.
- Remove All: Click this button to clear the queue.
- Only send one email alert per email failure: This works in conjunction with the "Try resending failed emails" in Options (Tools > Options). If a message cannot be sent and CRD is configured to notify you of any email failure, this makes sure an alert is sent to you only once and not every time the email fails due to the configured retry.
- Remove items from the Queue that are older than: Use this option to perform housekeeping on the email queue.
Error Log
The error log provides a detailed overview of any system errors that have been encountered, allowing users to easily identify and troubleshoot issues within the system.
You can filter out the entries displayed by using the search field to specify the keywords to filter by.
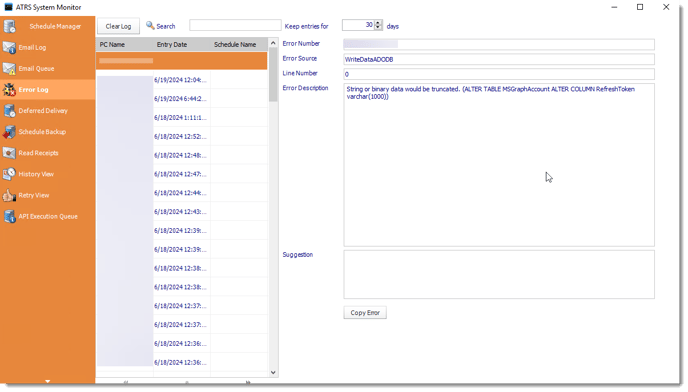
- You can filter out the entries displayed by using the search field to specify the keywords to filter by.
- To view the details of an entry simply select it and the details will be shown in the opposite pane.
- This can be very useful for troubleshooting purposes. You can also easily copy the details of a selected error using the "Copy error" button.
Deferred Delivery Exports
All exports that have been deferred will be visible in System Monitor, under the Deferred Delivery Tab.
Step 1: Select Deferred Delivery. Here you will see a comprehensive list and additional details of the reports that have been deferred for delivery.

Read Receipts
Read Receipts allow you to verify if the recipient has read an email sent to them. Tasks can be performed once or repeatedly until the read receipt is confirmed by ATRS. This feature is compatible with most Email Destinations.
Step 1: Select Read Receipts.

Read Receipts can only be used with Exchange email settings.
All emails awaiting a read receipt are visible in this section. You can easily sort your read receipts by status - whether delivered, pending, or received - by using the filter option.
Once the email is sent, a delivery receipt will be sent to you. You will also receive an email notification once confirmation that the email has been read is received.
History View
This screen shows you a history of all schedules (static and dynamic). If one destination out of many fails, the schedule will be marked as a "Partial Success." Expanding the node will reveal which reports or destinations failed.

Use the Purge Option to delete any history older than the specified time set.
Use the More data option to to print, save or manipulate this as a custom report.

Retry View
This screen displays a comprehensive list of schedules that have encountered failure. For schedules configured to retry, they will persist in the list until they either succeed or reach the specified retry limit. This feature enables users to easily track and manage schedules that require attention, ensuring timely follow-up actions to resolve any issues.

API Execution Queue
If you want to track the reports that have been generated through API executions, you can easily do so by accessing the System Monitor feature. By navigating to the API Execution Queue within System Monitor, you will be able to view a comprehensive log of all API executions that have taken place. This log provides valuable insight into the status and details of each report generated using the API.
