This article applies to:
- Power BI Service Reports & Dashboards (Cloud - Power BI Service)
Data-Driven Schedules for Power BI Service Reports & Dashboards
A data-driven schedule allows you to drive all variables of your reporting requirements (filters, destinations, output formats, etc.) from database tables and queries at run time. You can also use static text and default values should you wish. You can use Data-Driven schedules for a number of scenarios. Use a data-driven schedule for bursting reports based on filter values to specific formats like PDF, Excel and so on.
Here are some examples:
- Distribute a report to a fluctuating list of recipients. For example, you can distribute a report throughout a large organization where recipients vary from one month to the next, or use other criteria that determines group membership from an existing set of users. E.g. select * from mytable where firstname = ‘john’ will generate the report and distribute only for records where the recipient’s first name is John.
- Filter the report output using report filter values that are retrieved at run time. For example, the filter value returned from the table for the Last Name will be “Doe” for John Doe and “Smith” for John Smith.
- Determine the delivery type and report format dynamically at run time. For example, John Smith gets the report as a PDF file by email with a customized email body and John Doe gets the report as an excel spreadsheet by FTP upload to his webserver.
The following simple example will illustrate the process of creating a Data-Driven Schedule.
Scenario: You have a report which has a large number of filter and destination combinations. Representing the combinations in a table may look something like the example below (Yellow = filters)
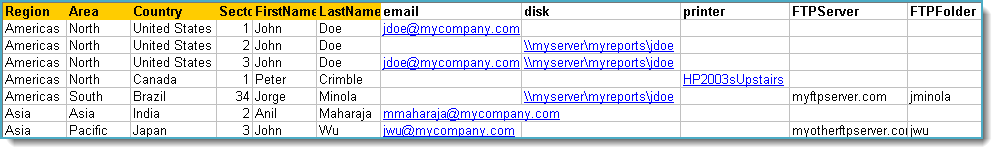
- You need to have the report run once for each record. The filter values entered in the table above should populate the filters in the report and the report should be delivered to the destinations shown in the table.
- Please note that with the above data when the schedule runs, the following will occur:
- John Doe will receive only one email for the reports from sectors 1 and 3. He will also get the reports from sectors 2, 3 and 34 delivered to his reports disk location.
- Peter Crimble will have his report printed on the Printer he specified.
- Jorge Minola will have a copy of his report sent to John Doe to the disk location he specified and a copy uploaded to his FTP server and folder.
- Anil Maharaja will receive an email as requested.
- John Wu will have his report delivered to his email and FTP server as requested.
Note that as the data changes in the database to reflect the requirements, the reports will be delivered as necessary without requiring any changes to the schedule in PBRS.
Using a Data Driven schedule PBRS will reel through the database table and generate and deliver a report for each record using the information provided.
The data driver allows for bursting reports to different formats and different destinations as well as defining other more traditional values like filters.
How do I create Data-Driven Schedule for Power BI Service Reports & Dashboards?
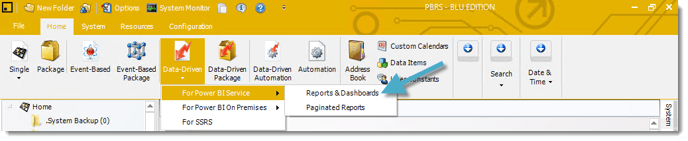
Step 1 - Navigate to Data-Driven and go to For Power BI Service and select Reports & Dashboards.
Building a Data Driver Wizard
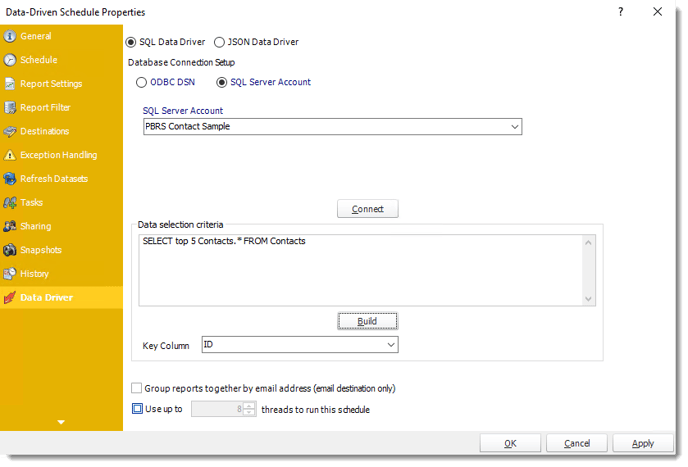
Step 2 - Build a Data Driver. The Data Driver is where you set up the source for data for your data-driven reports.
- If your data source or data selection criteria changes this is where you will need to make any required changes. You can either select SQL Data-Driver or JSON Data-Driver.
SQL Data Driver
- ODBC Datasource Name: Check this option to sue ODBC DSN. Drop down and select a DSN.
We strongly recommend System DSNs so that the DSN is visible to PBRS even when the user associated with the DSN is logged off.
All communication to databases (including Access databases) is done through ODBC, so you must setup a system DSN to the database before you can use this facility.
When setting up DSNs we recommend (if possible) that you use Windows Authentication (Trusted Connection). This ensures that your username and password are not required to be stored in PBRS (more secure) and overcomes a large number of security restrictions which Windows places on DSNs. When using Windows Authentication, make sure that the PBRS NT service user (or background application service user) has full rights to the database otherwise, though you will connect when you are logged in, automated scheduling will fail if the Service user has not got rights to the database.
When setting up a DSN to a SQL server, you must ensure that the "Default Database" setting is set to the database you are connecting to (Windows defaults this to "Master").
- UserID: Enter the User ID PBRS should use to log on to the database.
- Password: Enter the password associated with the above user.
- SQL Server Account: Check this option to use your SQL Server Account.
You must add the SQL Server Account in Integrations.
- Connect: Click Connect to connect to the Database.
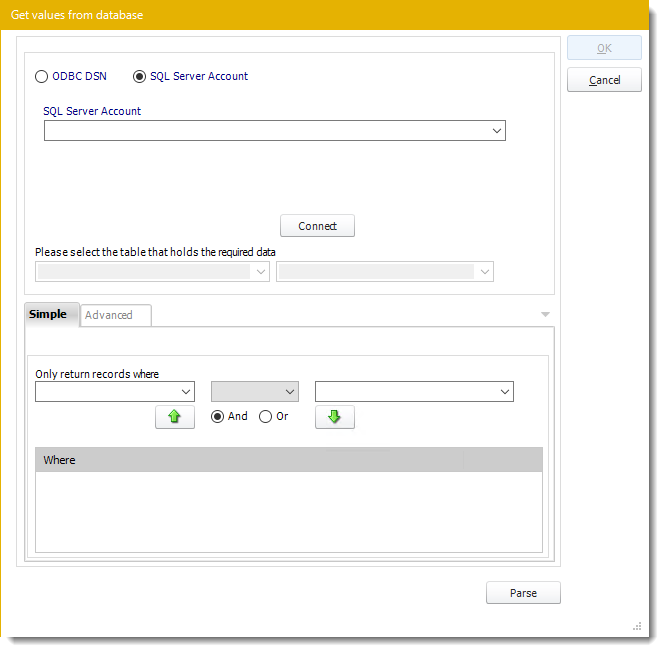
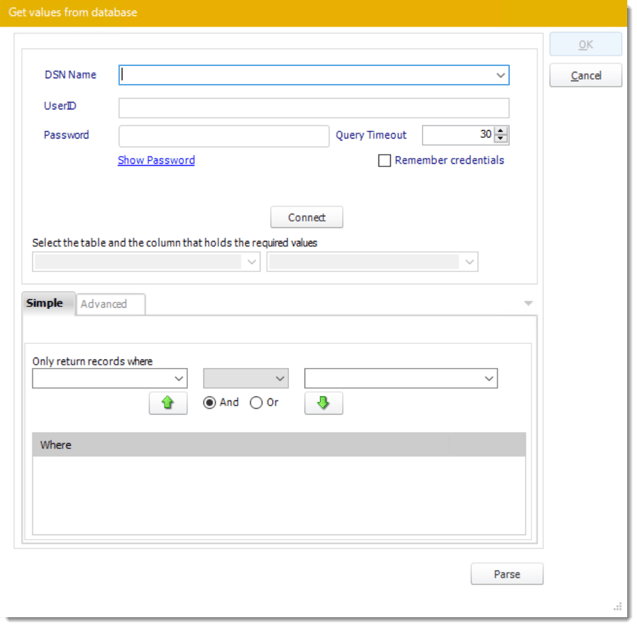
- Select the table from the database that holds the required data. You can refine your selection query by using the simple or advanced tabs.
Step 3 - Click Parse to check that the query returns the expected data.
- For more information on the "Get Values From Database" interface, click here.
Step 4 - Click OK to save the Data Driver.
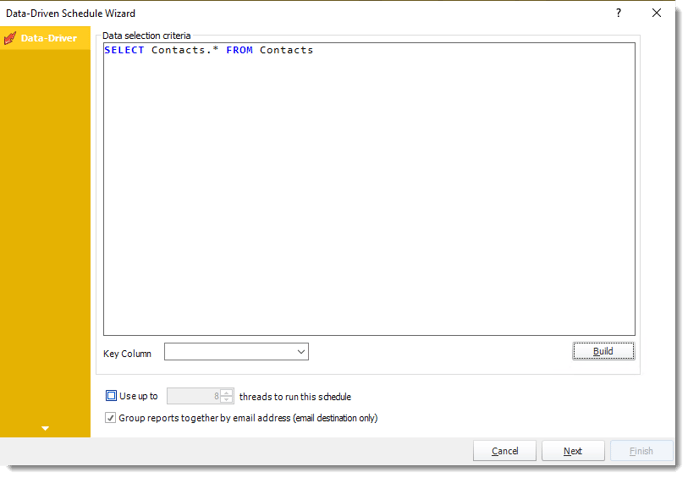
- Click Build to specify the data selection criteria. This will return you to the Build Data Driver tool.
- Key Column: Select the key column for the data that is returned for the reports. The information that drives the schedule is required to have a key column so that each row in the table is uniquely identified by the value in this column. The key column is there as an identifier which is used to troubleshoot in cases where there is a problem with one of the records.
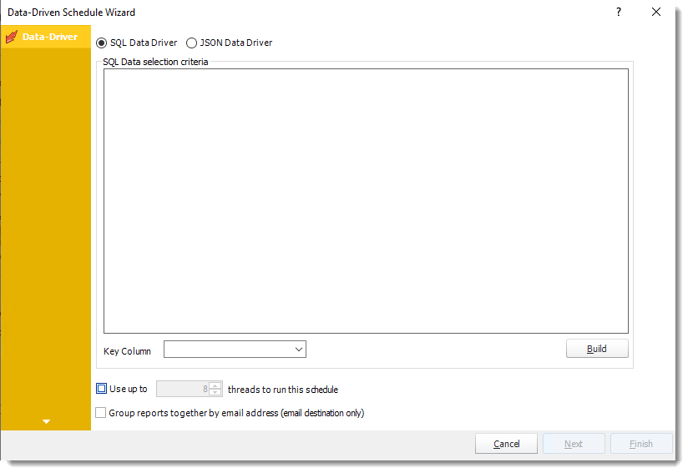
JSON Data-Driver

- Enter your JSON string and click Validate.
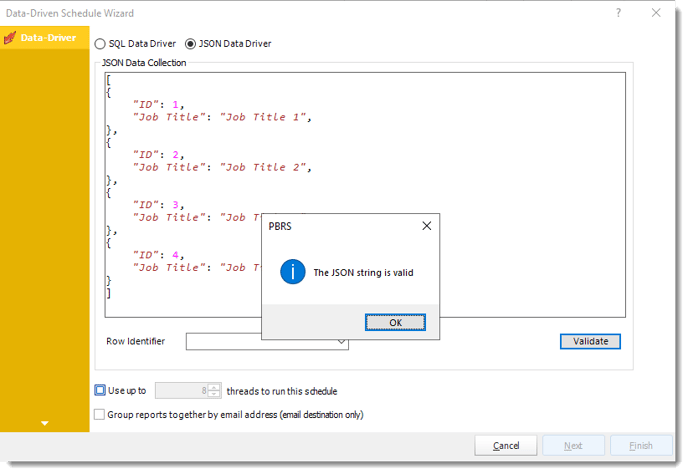
- Row Identifier: Select the row identifier for the data collection for the reports. The information that drives the schedule is required to have a row identifier so that each row in the table is uniquely identified by the value in this column. The row identifier is there as an identifier that is used to troubleshoot in cases where there is a problem with one of the collections.
- Use up to 'x' threads to run this schedule: Check this option to allow x amount of threads to be exported simultaneously.
- Group reports by email address: You can instruct PBRS to group reports that are sent to the same email address. Please note that enabling this option disables the ability to embed the reports in the email body for email destinations.
Step 5 - Click Next to continue to the next wizard section.
General Wizard
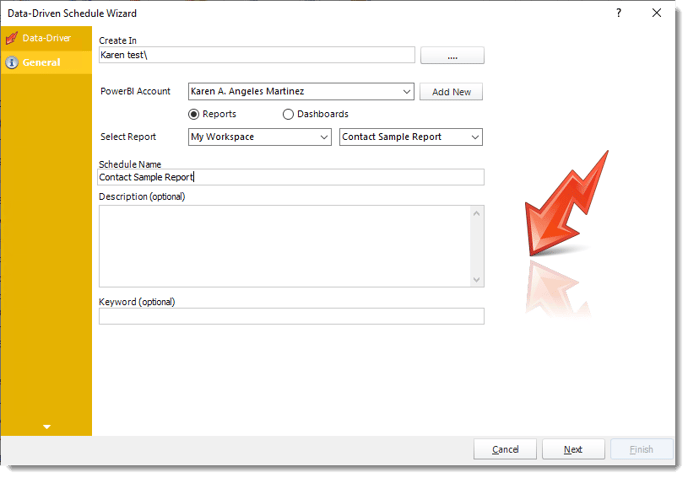
- Create In: This section is for selecting the folder where you want to create the single report in.
- Power BI Account: This section is to select what Power BI Account you want to create the single report in. In this section, you may add a new account in the Add New button.
- Select Report: Click on the drop-down menus to navigate to the required report.
- Schedule Name: Write in the name of the package.
- Description (optional): You may write a short description to help other users identify exactly what this schedule is and what it is expected to do.
- Keyword (optional): Enter some keywords which can be used later by Smart Folders to identify this schedule.
Step 6 - Click Next to continue to the next wizard section.
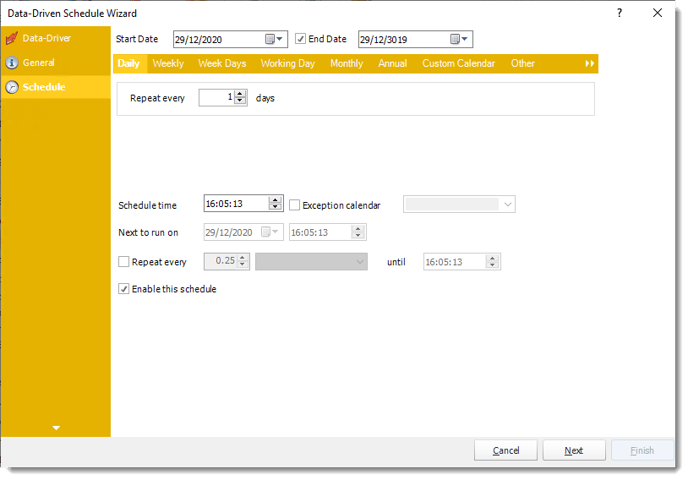
Schedule Wizard
Step 7 - In this section, you will decide when the report will execute. There are a variety of options.
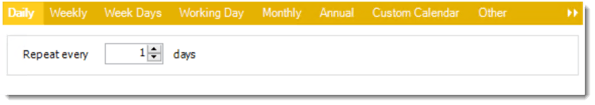
- Daily: Run a report every day or at a frequency of days.
- Sub options: Repeat every X Days.
Example: Run the schedule every 3 days.
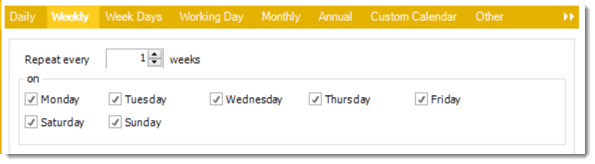
- Weekly: Run a report on a weekly time frame.
- Sub options: Repeat every X weeks.
Example: Run the schedule every 2 Weeks.
- On: Select the specific days of the week the schedule will run. If only once a week, select only the day of the week it will run.
Example: Run every Monday, Wednesday, and Friday.
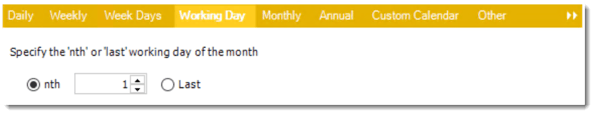
- Week Days: Run the schedule Monday through Friday.

- Working Day: Run the schedule starting on a specific day of the month. Indicate which day of the month the schedule will run. E.G. run the schedule on the 4th working day of the month.
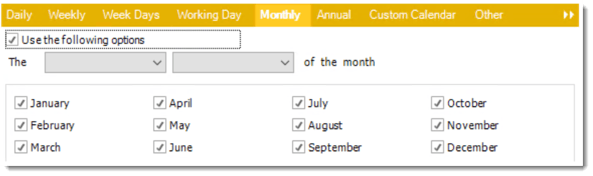
- Monthly: Run the schedule on a monthly time frame.
- Use the following options: Checking this box will enable you to select frequency options such as the “last Thursday of the month.” Also you can include or exclude specific months from the schedule.
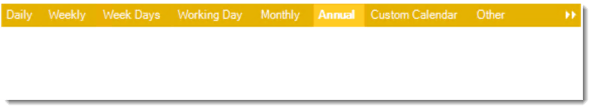
- Annual: Run the schedule every year at a specified time.
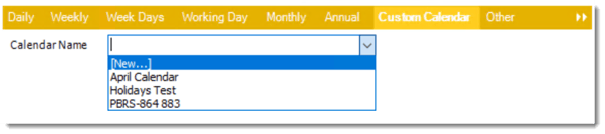
- Custom Calendar: Select the custom Calendar you wish to use. You can create a new custom calendar from the menu as well. Please see Custom Calendars for more information.
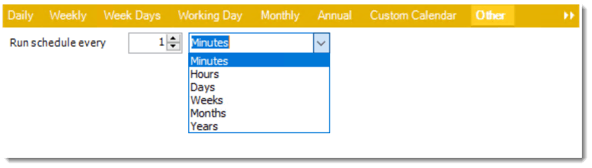
- Other: Other scheduling options.
- Run Schedule every X Minutes, hours, days, weeks, months, years.
- None: No scheduling is required for this item.

- Start Date: Enter the desired starting date for the schedule. This section can be the current date (providing schedule time has not already passed) or a date in the future.
- End Date: If the schedule is due to end after a certain date enter that here. If the schedule is to run indefinitely, then leave it blank.
- Schedule time: On the Next Run date, the package will run at this time.
- Exception Calendar: Choose a calendar that will instruct the schedule to NOT run on those specified days. Please see Custom Calendars for more information.
- Next to run on: The package will next run on this date.
- Repeat Every: Rerun the package every x minutes from the scheduled time until your specified time.
For example, you can set up a daily package to run every day at 8 am, and to run every hour until 5 pm.
- Until: After this date, there will be no automated scheduling of this package.
- Enable this Schedule: Uncheck this option to Disable the package. Disabled packages are not deleted, but they do not execute automatically. You can re-start the automatic scheduling at a later date by checking this option again. Or right-clicking this schedule from the main screen and selecting Enable.
Step 8 - Click Next to continue to the next wizard section.
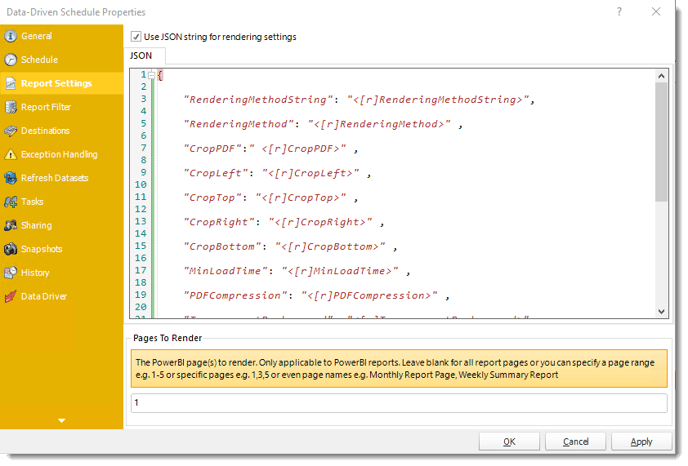
Report Setting Wizard
Step 9 - In this section you can configure some settings for the exported Report / Dashboard.
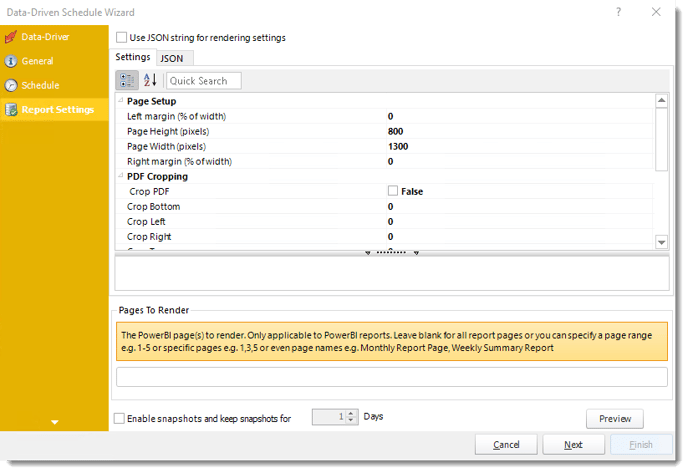
Settings and JSON Rendering settings may overwrite each other so it is best to only set one or the other.
Settings
- Left margin (% of width): The size of the left margin as a percentage of the page width.
- Page Height(pixels): The height of the rendered file.
- Page width (pixels): The width of the rendered file.
- Right margin (% of width): The size of the right margin as a percentage of the page width.
- PDF Cropping: You may crop your reports by page height (pixels) and page width (pixels).
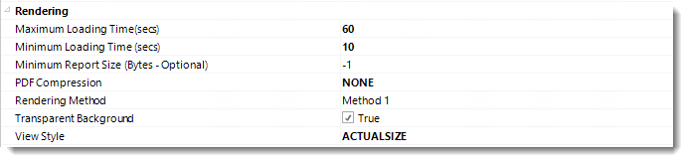
- Maximum Loading Time(secs): The maximum amount of time that the renderer will wait before timing out.
- Minimum Loading Time(secs): The amount of time that PBRS will wait for the dashboard/report to load before rendering it to file.
- PDF Compression: Select PDF compression levels.
- Rendering Method: Select the rendering method type for your Power BI report.
- Transparent Background: You have the option to have your Power BI report in a transparent background.
- View Style: How the report fits on the page: Fit to Page, Fit to Width, or Actual Size.
- Page To Render: The Power BI page(s) to render. Only applicable to Power BI reports. Leave blank for all report pages or you can specify a page range e.g 1-5 or specific e.g. 1,3,5. You can enter page names e.g. Monthly Report Page, Weekly Summary Reports.
You can drag and drop Inserts constants into Pages To Render textbox.
- Enable snapshots and keep snapshots for "X" Days.
- Preview: By clicking here you may see the preview dashboard/report.
JSON
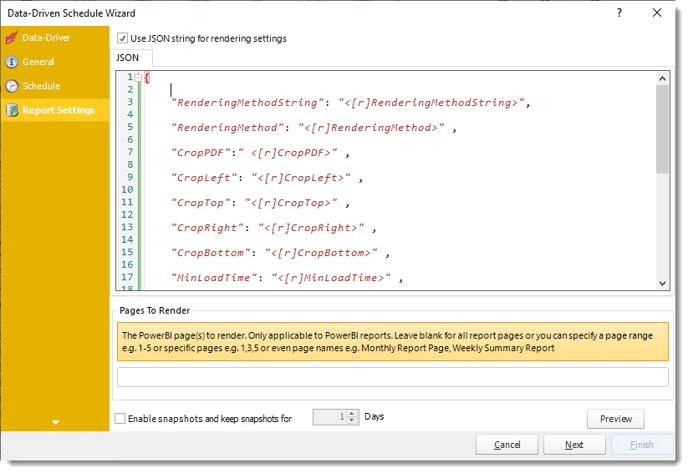
- Use JSON string for rendering settings: Check this option to use JSON string for the rendering settings.
- Enter the JSON string.
You can drag and drop Inserts constants into JSON textbox.
Step 10 - Click Next to continue to the next wizard section.
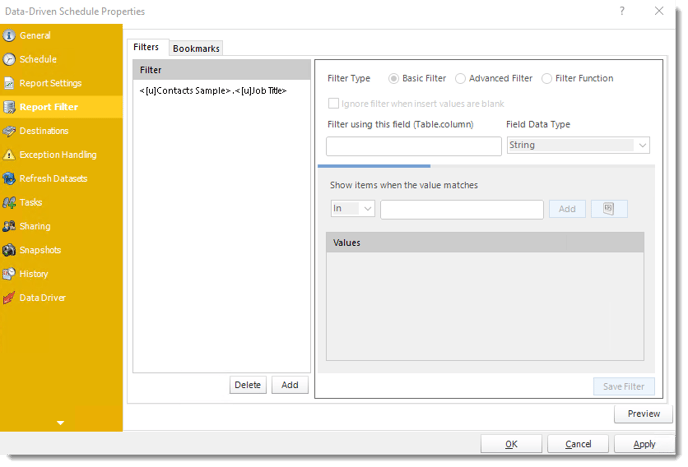
Report Filters Wizard
Step 11 - In this section, you will determine the filters for your report (if any). If your report has no filters, you may skip this section by clicking next.
- With PBRS, you can Data Drive any filter in your report. Ensure the filter values for each record are listed in your database.
- Using Data-Driven Inserts you can pull these values into your report.
- Drag and drop your Data-Driven inserts into the desired filter fields. If you do not wish to enter a data-driven value in your filter, you can still manually type a value or select them from the drop-down box.
- You can also use Inserts Constants to filter the table and column.
For more information about Report Filters Wizard, click here.
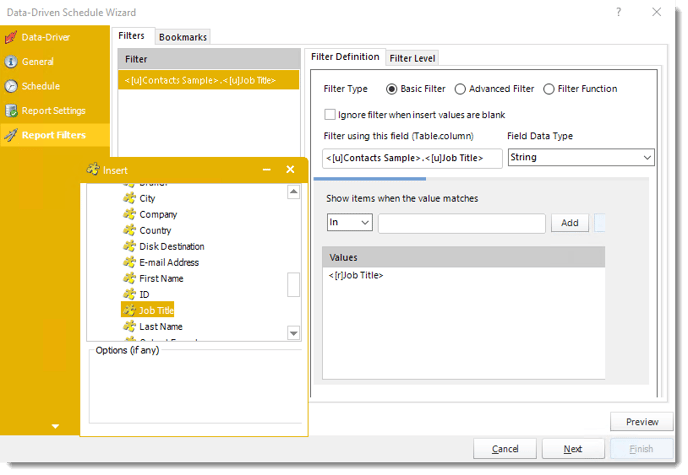
Filters
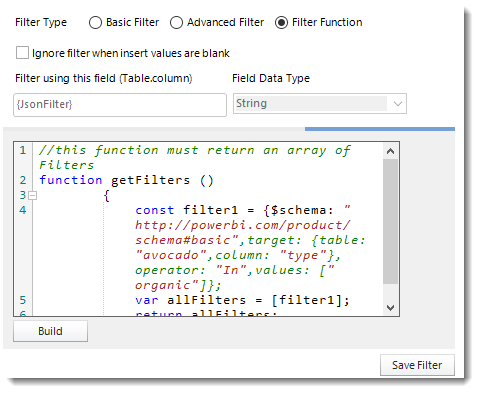
Filter Definition
- Filter Type: You may choose between Basic Filter, Advanced Filter, or Filter Function.
- Ignore filter when insert values are blank: Check this option when the filter values are blank.
- Preview: View the dashboard/report output given the selected filters.
- Filter using this field (Table.column): Choose the table and column you would like to set up the filter.
Basic Filter
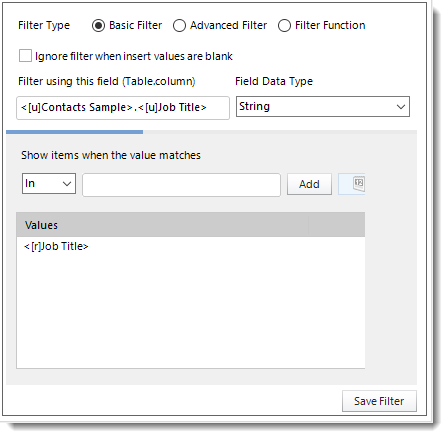
- Click Add.
- Enter the Table.Column names in Filter using this field textbox.
- Select the Field Data Type.
- Select an operator in Show items when the value matches.
- Show items when the value matches: Insert the value you would like to add and then click Add.
- Click Save Filter.
Advanced Filter
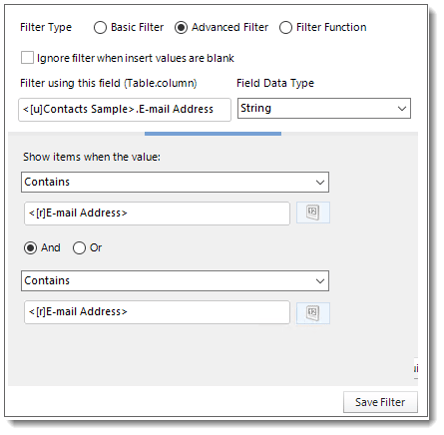
- Click Add.
- Select Advanced Filter.
- Enter the Table.Column names in Filter using this field textbox.
- Select the Field Data Type.
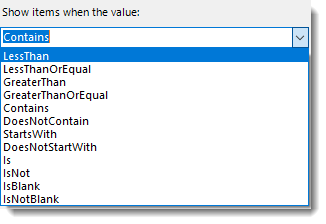
- Show Items when the value: In this option, you have the option to show items and select the option from the drop-down menu.
- Click Save Filter to add the filter.
Filter Function
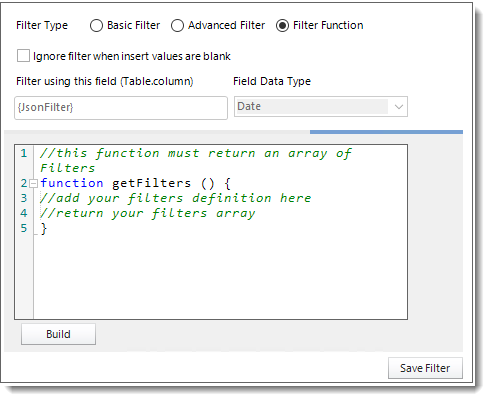
- Select the Filter Function option to enter an advanced Filter JSON string so you don't have to manually configure filters in PBRS.
- Click Build.
- Enter the Filter JSON string.
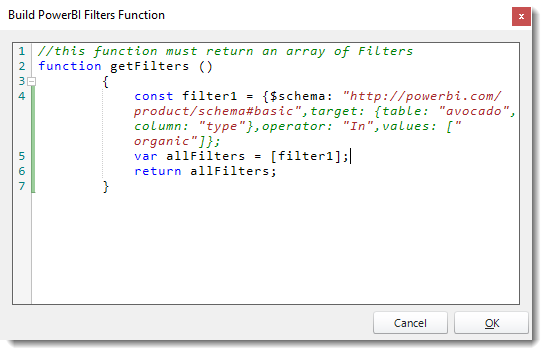
- Click OK.
- Click Save Filter.
Filter Level
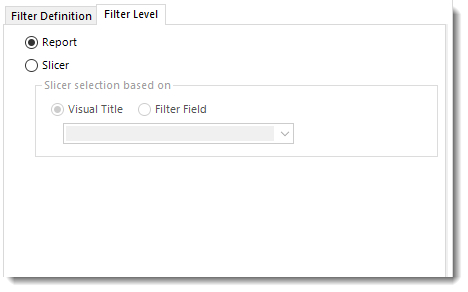
- Report: Check this option to filter the level of the report based on the filter field (Table.Column) value.
- Slicer: Check this option to filter the report based on the slicer visual icon and the filter field value. Using Slicer, all the values of the slicer will be displayed and only the entered value on Filter Field will appear checked.
In order to use the Slicer filter, you must have a Slicer visual in your Power BI Report.
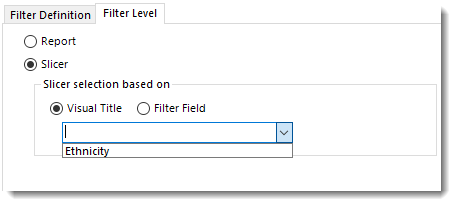
Slicer
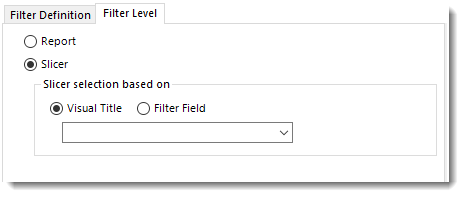
Visual Title
- Visual Title: Using this option, you can select the slicer selection based on the Visual Title of the report. Select the slicer visual title using the drop-down menu.
- Click Save Filter.
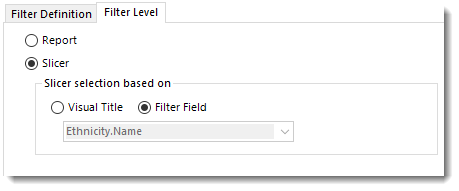
Filter Field
- Filter Field: Using this option, you can select the slicer selection based on the Filter Field (Table.Column).
- Click Save Filter.
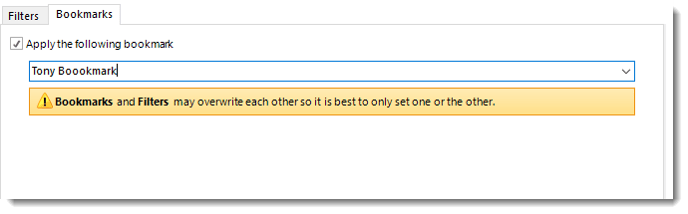
Bookmarks
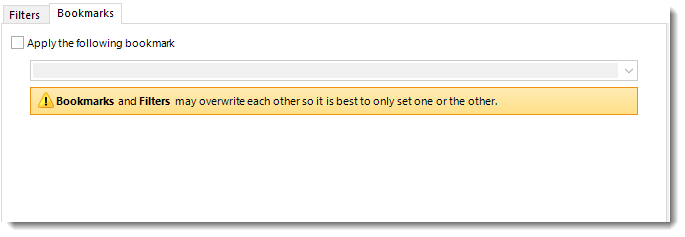
Bookmark and Filters may overwrite each other so it is best to only set one or the other.
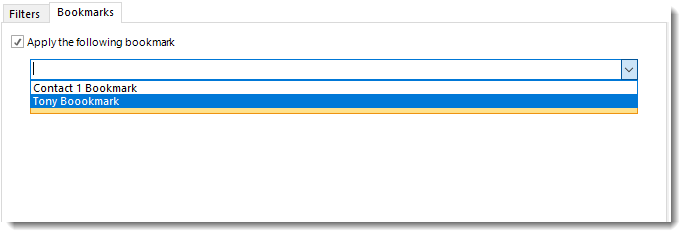
- If you have a Bookmark in the report you have the ability to select the bookmark using the drop-down menu.
- Check Apply the following bookmark to enable the Bookmarks option.
- Select the bookmark from the drop-down menu.
Step 12 - Click Next to continue to the next wizard section.
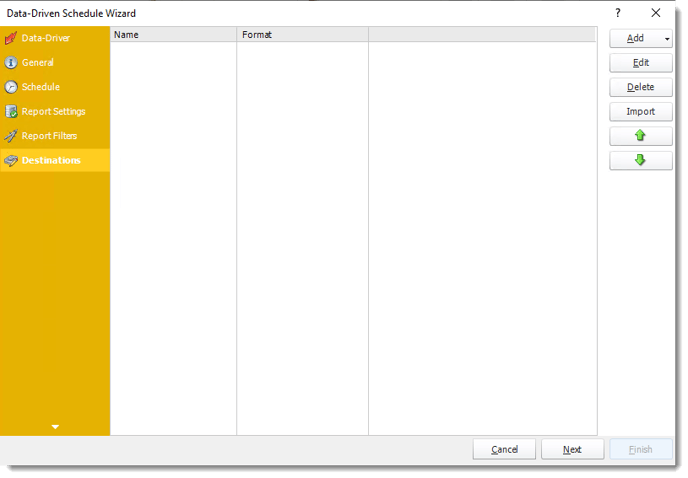
Destination Wizard
Step 13 - In this section, you will decide where your schedule will be delivered. The list in the center will display the list of destinations you have added to the schedule. You can organize the various destinations’ order by clicking on the green up and down arrows.
-
- For more information of adding destinations, click here.
- For more information about Output Formats, click here.
- Edit: Select a destination and click to edit it's properties. Or simply double-click on the destination.
- Delete: Select a destination and click this button to delete it.
- Import: Click here to import from the list of default destinations.
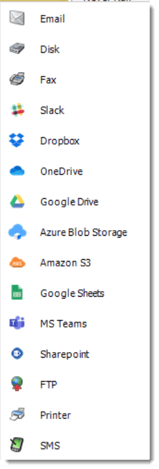
Customizing the Destination
With the Data Driven Schedule, you can determine the delivery method of your report based on your data. In your table, specify the delivery method by creating a column for each delivery type (FTP, SharePoint, Email etc.). For each record specify their email, fax number, and so on.
Tip: For email destinations, simply add a semicolon after an email address to send the same instance of the report to another email address.
- Data driving the Report's Distribution
- As mentioned above, PBRS will pull delivery data from your database.
- In this example, we will be using email addresses found in the table.
- With Data Driven inserts, simply drag and drop the field that indicates your desired destination (email in this case).
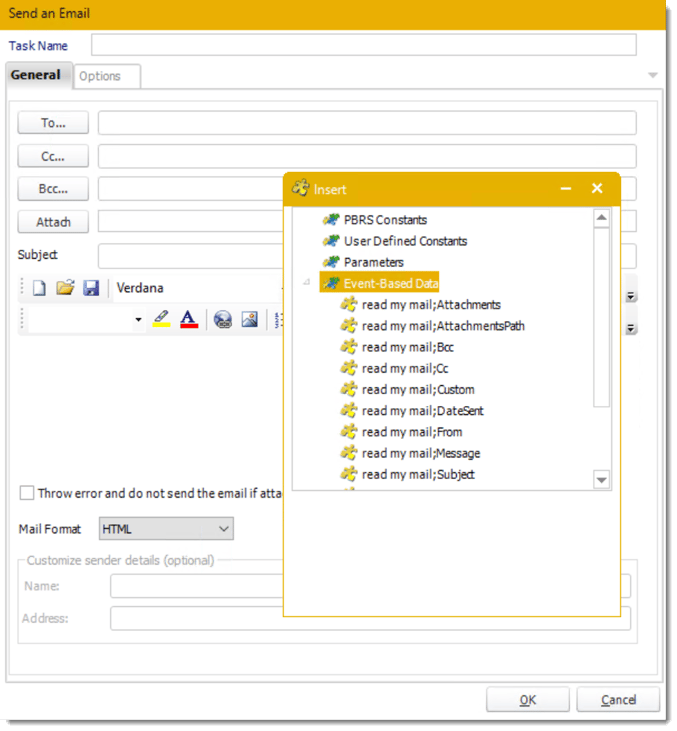
- Now PBRS will deliver a unique report based base on a corresponding email address.
Customize Recipient Messaging
- You can also customize the messaging the recipient receives. Using Data Driven Inserts, PBRS will automatically pull data from your table and use it to customize the subject, body or report format.
- Simply drag and drop fields from your table to the desired position.
For example, to customize an email greeting, type the greeting, and add the recipients name as shown above.
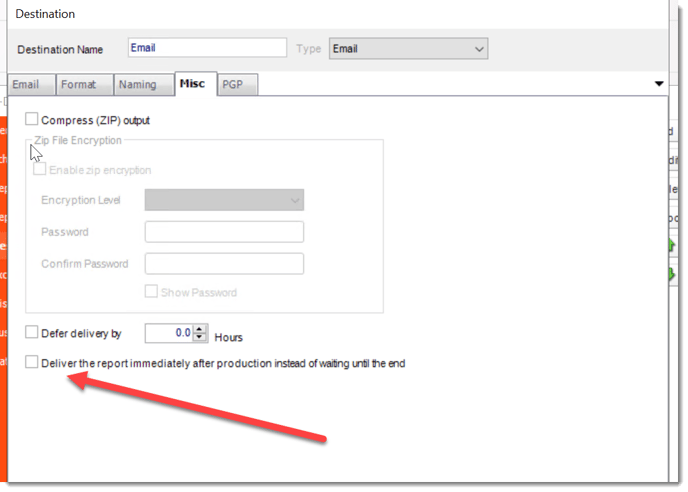
NOTE: For an email and disk destination, under the Misc tab, you have the option to deliver the report immediately by checking the box labeled 'Deliver the report immediately after production instead of waiting until the end'.
Step 15 - Click Next to continue to the next wizard section.
Exception Handling Wizard
Step 16 - In this section you will determine Schedule Retries should an error occur and set up what action should be taken if a Report Export is Blank or if the Report Export Fails.
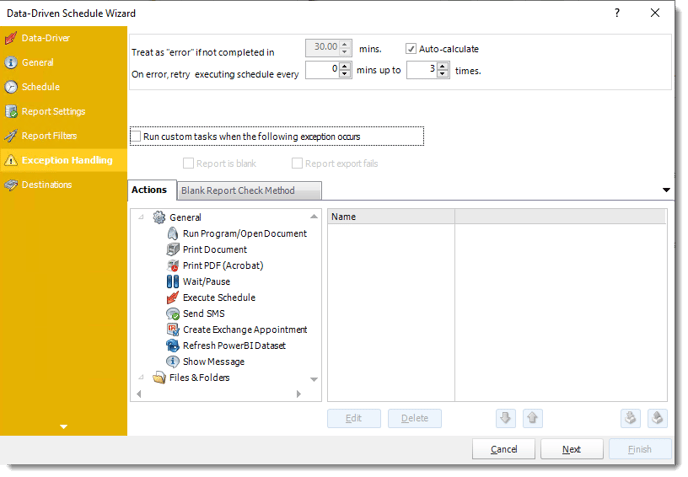
- Treat as “error” if not completed in X minutes: If a report takes longer than the specified amount of time to run, this option will treat the schedule as an error and follow the appropriate action. The “Auto-calculate” option instructs PBRS to automatically determine how long a schedule should take to run the report. If it takes longer than the calculated amount of time, then it is an error.
If manually determining the error timing, please double-check the run time of the report in order to get the correct time estimate.
- On error, retry executing schedule every: If set to 0, PBRS will deem the schedule as "Failed" the first time it encounters an error. The schedule will not run again until its next scheduled time. Change the value to tell PBRS how many times you want it to retry running the report before declaring it as "Failed."
- Run custom tasks when the following exception occurs: Check this is option to enable the following options.
- Report is Blank: If a report is blank because it genuinely returned no data, recipients can misconstrue this as an error with the scheduler. This option allows you to identify genuine empty reports and instruct PBRS on what to do with them.
- Ignore the report and subsequent tasks: If the report is blank, do not send the report. The report will not be delivered to the destination. No custom tasks will be run.
- Report exports fail: If a report export fails, you can receive a notification or run a task that the report failed to execute.
Actions
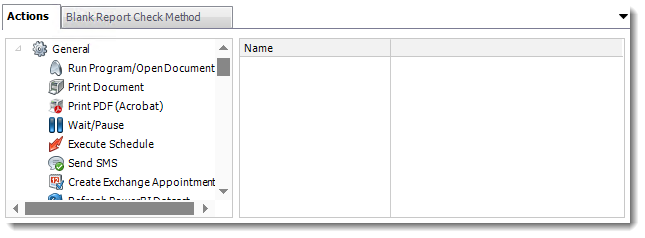
- Select an action from the task list. This task will be executed in the event that a schedule is blank.
- For more information about tasks, click here.
You can send a notification if a report is considered blank instead of sending the report. Simply select “check if a report is blank” then select “Ignore the report.” In the actions tab, select “Send Email” from the list. Compose your email and save.
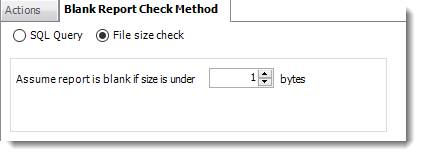
Blank Report Check Method
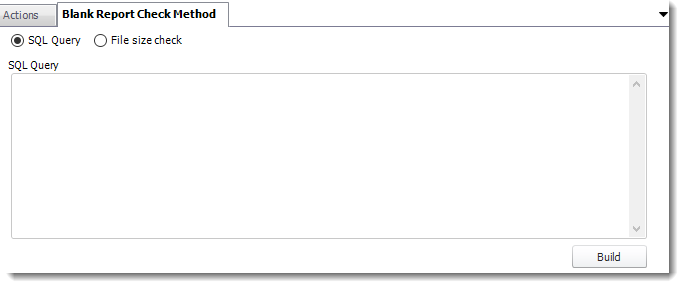
- Select the Method that will determine whether a report is blank.
- SQL Query: Select this option to use a user made query that will determine if the report is blank. If the query returns no results, the report is blank.
- Click Build.
- Get values from a database window will appear. For more information about Get values from database, click here.
- File size check: Assume reports is blank if size is under "X" bytes.
Step 17 - Click Next to continue to the next wizard section.
Refresh Datasets Wizard
Step 18 - In this section select the datasets to refresh before the report is executed.
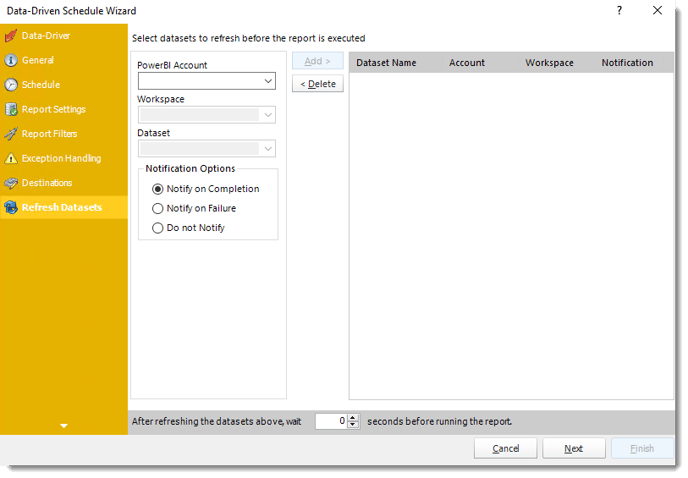
- Power BI Account: Select the account to refresh datasets.
- Workspace: The path to the required report.
- Dataset: Select the dataset.
- Notification Options: Receive a notification after the report is executed, the report failed to execute, or do not receive a notification.
- After refreshing the datasets above, wait 'X' seconds before running the report.
Step 19 - Click Next to continue to the next wizard section.
Custom Tasks Wizard
Step 20 - In the section you have the option of setting up Custom Tasks. Custom tasks are business process automation tools that can be auto triggered before or after a report runs. Simply navigate to the task you would like to set up and drag & drop to the right hand side of the screen. This will automatically open the Configuration screen for the selected task.
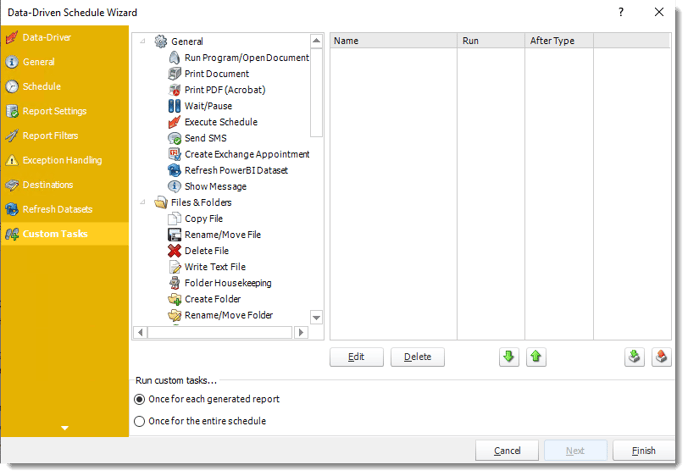
- For more information on Custom Tasks, click here.
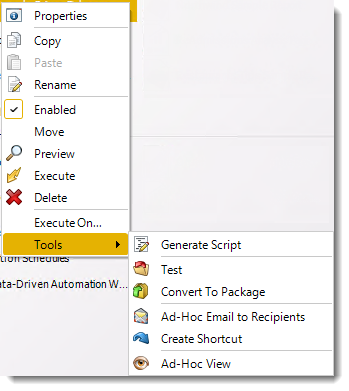
Data-Driven Schedule Context Menu
Right-Click on a schedule to see the following actions.
- Properties: Edit the schedule from here. Or you can just double click on the schedule.
- Copy: Use this to copy the schedule. Right-click in the "white space" of the folder you wish to copy it to and select the Paste button.
- Rename: Rename the package.
- Enabled: Schedules are enabled when there is a check icon beside this option. To stop a schedule from running, or to "pause" it for a while, select this option to remove the check icon. Disabled schedules will not run until they are enabled again.
- Move: Use this option to move the report into an existing package.
- Preview: Preview the report before execution.
- Execute: This button will execute the schedule immediately. Note that the next run date and time is not moved on as a result of a manual execution. They only move on if the schedule is run automatically by one of the schedulers.
- Delete: Selecting this option will delete the schedule.
- Execute On: Use to option to execute the schedule to another collaboration server.
- Test: Use this option to test the schedule and export it to selected "test" destinations.
- Convert To Package: This button will move this report into a package. The package will have the name of the single schedule report.
- Ad-Hoc Email to Recipients: Select this option to send an ad-hoc email to all recipients of this package. You can use this to alert recipients to a planned system outage, or any other useful information.
- Create Shortcut: Use this option to create a shortcut you can save in any location on your PC. Execute the shortcut to execute the schedule in PBRS.
- Ad-Hoc View: This button allows you to preview the report.
Data-Driven Schedules Properties
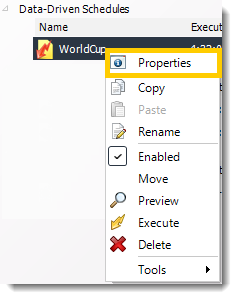
- To access your schedule properties, right-click on a schedule and select properties.
- Similar to the schedule wizard, you adjust settings to your schedules such as timing, error handling, or custom tasks.
- General
You can view the Schedule Unique ID in the General Wizard.
- Schedule
- Report Settings
- Report Filter
- Refresh Datasets
- Destinations
- Exception Handling
- Tasks
- Sharing: Here you can share this schedule with multiple users.
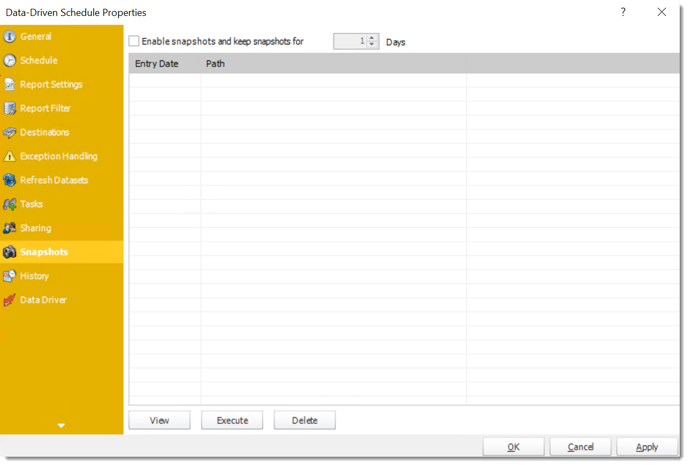
- Snapshots: A snapshot is a copy of each report a schedule or a package generates. Keeping snapshots enables you to resend past reports without generating them afresh - especially if the data has changed in the meantime.
- Simply select the number of days to keep the snapshots.
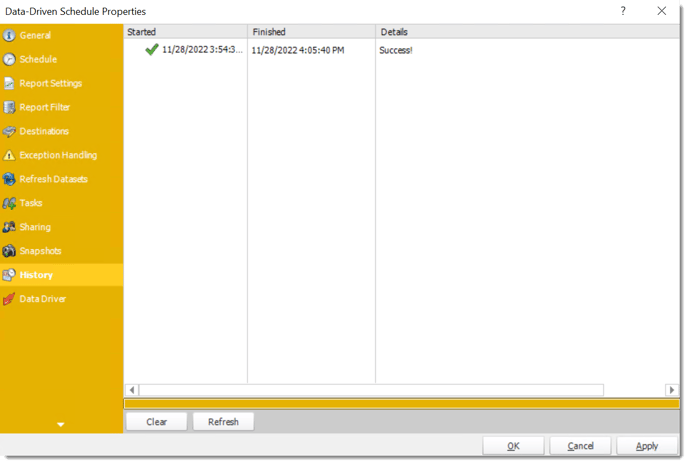
- History: Review the schedule's history. Successes, failures, and other data is located here.
- Data Driver