Dashboards can be created and edited via the workshop menu. In this section, you can learn how to create each visual in Dashboards.
Reporting - Dashboards
Dashboards can be created and edited via the workshop menu.
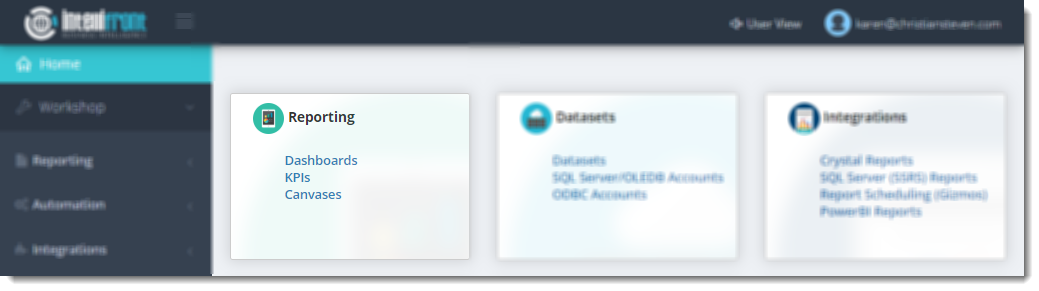
- Go to Workshop and select Reporting.
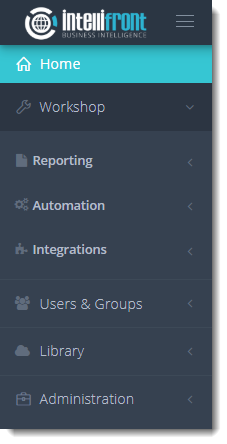
- In Reporting, select Dashboards.
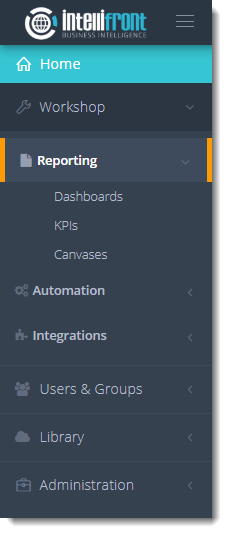
- Or select Dashboards from the card on the home screen.
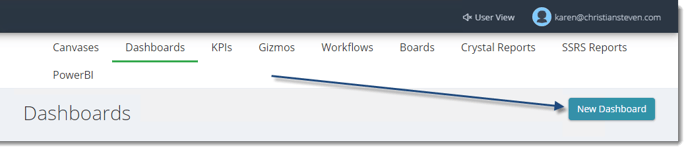
- Click New Dashboards.
- Add Name: Give the Dashboard a unique name.
- Click the checkmark next to the name to save the name and to begin creating the Dashboard.
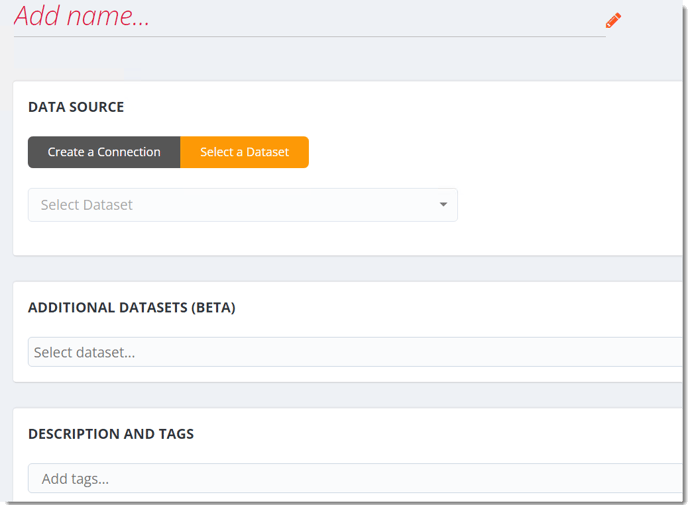
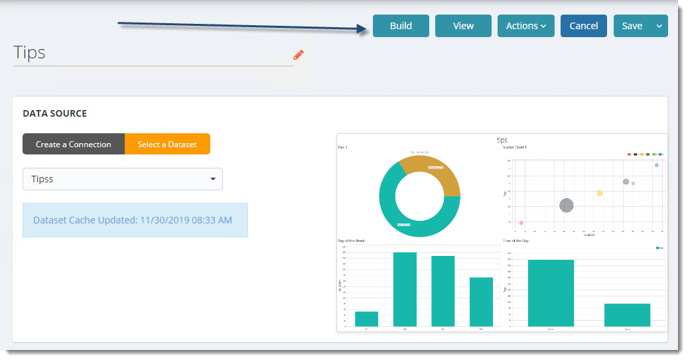
Data Source
- Create a Connection: Choose the type of database you are connecting to e.g. Oracle, Microsoft SQL Server. Then complete the login credentials.
- Select a Dataset: Choose a dataset from the drop-down list.
Datasets must have been set up within the library before they appear here.
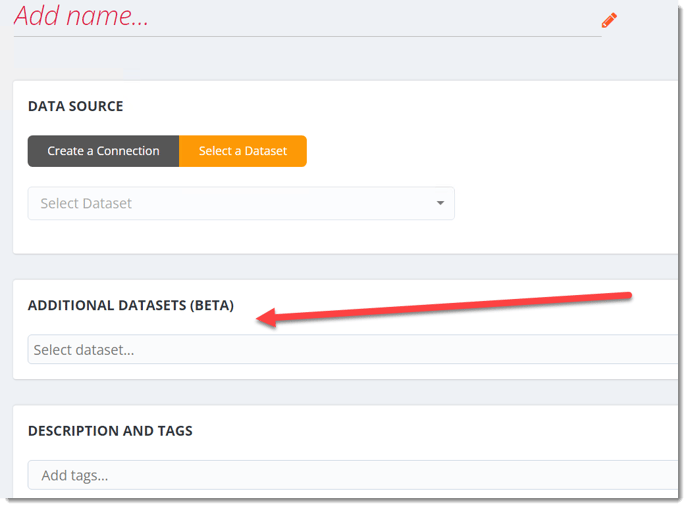
- Additional Datasets (Beta): You can now select multiple datasets to create your dashboard. This allows for more information to be added so that you can analyze more data at once.
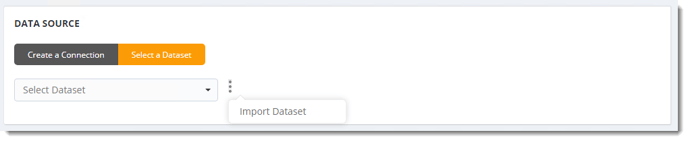
- Import Dataset: You can import a dataset to use in your dashboard.
For more information about Import/Export Dataset, click here.
Description and Tags
- Tags: Tags are optional and make it easy to categorize dashboards, e.g. if you want to create a Tag called financial for all financial dashboards.
- Description: Descriptions are optional but they can be used to explain what the dashboard shows.
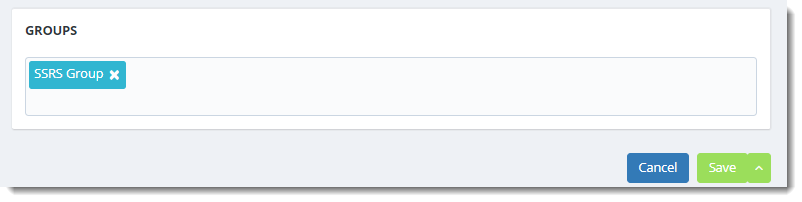
Groups
- Use groups to determine which groups of people have access to which dashboard.
Groups must have been set up within Users and Groups - Groups Manager
Act Menu
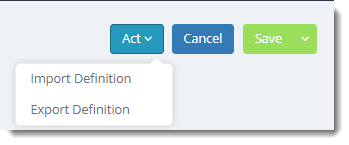
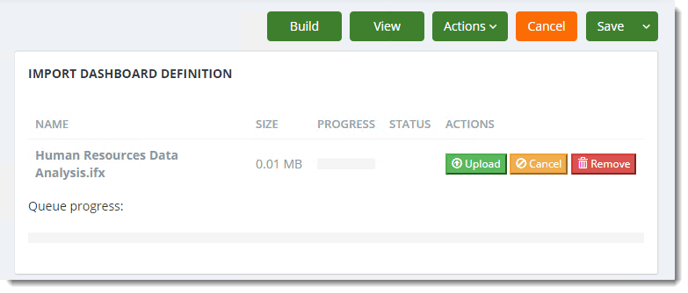
- Import Definition: This can be used to import a Dashboard definition so that the design is already there.
For more information about import dashboard definition, click here.
- Export Definition: This is used to share dashboard designs between teams in your organization.
Save Menu
- Save and Close: Save the Dashboard and returns you to the Dashboard main page.
- Save and Create Another: Save the dashboard and create another dashboard.
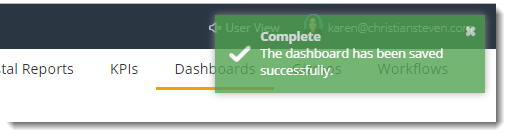
- When the dashboard has been saved successfully the following message will appear.
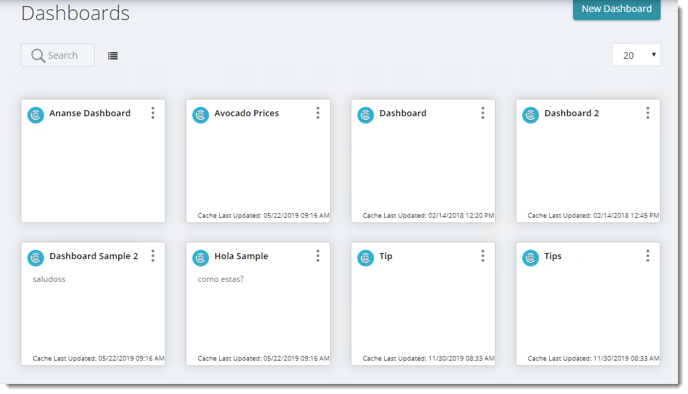
- All Saved Dashboard will appear on the main dashboard home screen.
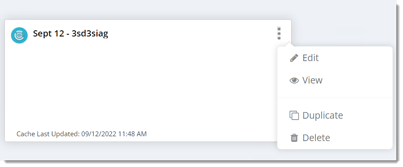
Dashboard Context Menu
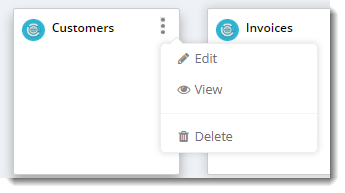
- Use the (…) option to Edit, View or Delete the Dashboard.
Creating a Dashboard
Note: The following enhancements have been made to assist with creating a dashboard:
- The ability to create custom Aggregation Functions.
- An added new (joinRule) function to allow comparisons of metric values between the current and the shifted time period (Parallel Period).
- An improved rebinding dashboard items function.
- You can now rename a data source using the Web Dashboard's UI.
Create Custom Aggregation Functions
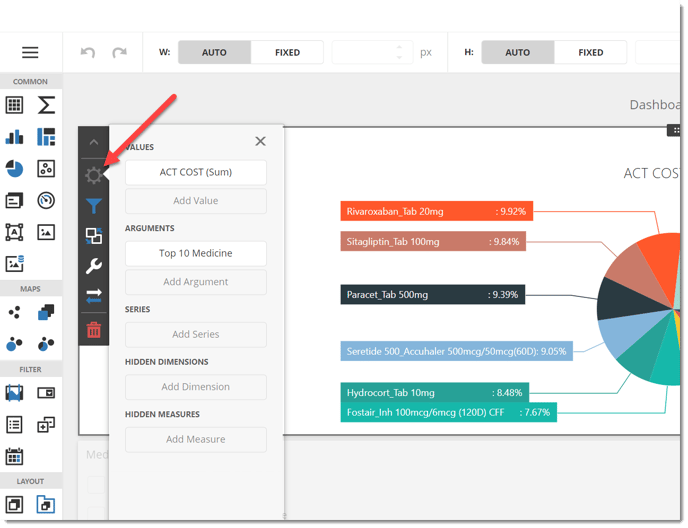
- Aggregated functions serve to create aggregated expressions. Along with predefined aggregations, the Dashboard supports custom aggregation functions. These can be created by a developer and access through the Calculated Field.
- To access custom Aggregation Functions, first click on the Binding button. Then, under any data selection click on the (f) button. See below.
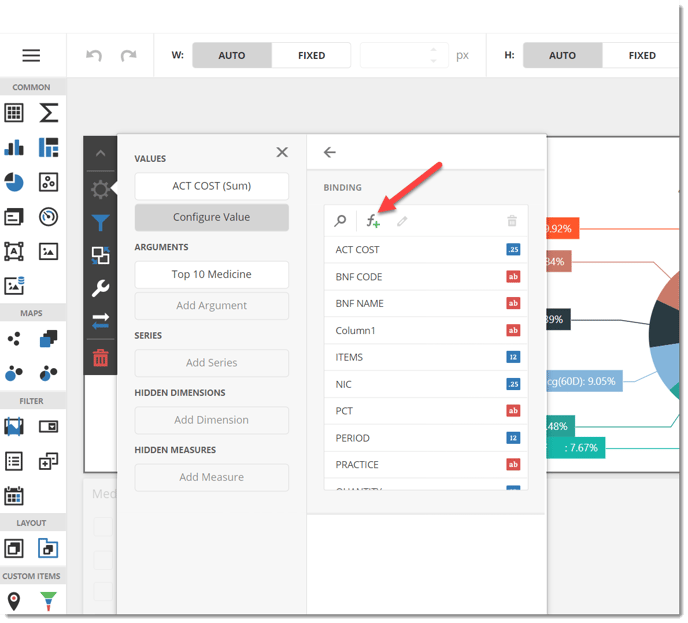
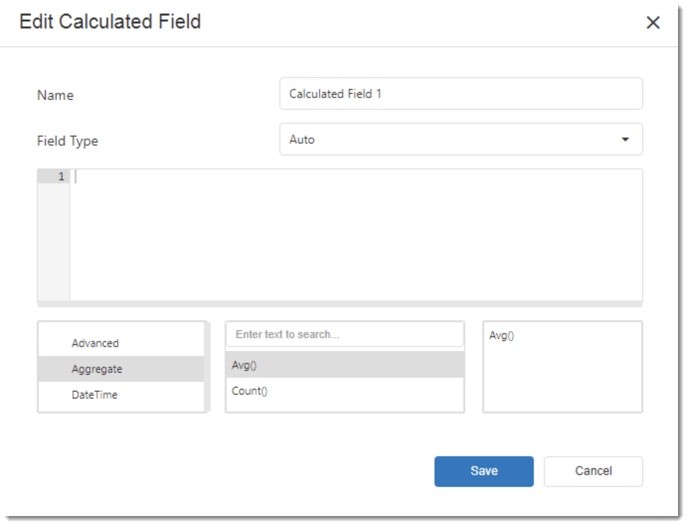
- The Edit Calculated Field will show up and there you can enter whatever specifications your dashboard requires.
- Name: Enter the name of the calculated field.
- Field Type: In this section, any preferred field type can be selected.
- Box: Here, you can enter what functions you would like the dashboard to focus on.
- Functions: In this section, you can choose what functions you need to incorporate. You can choose between Advanced, Aggregate, DateTime, Logical, Math, String, and Window.
- Click Save.
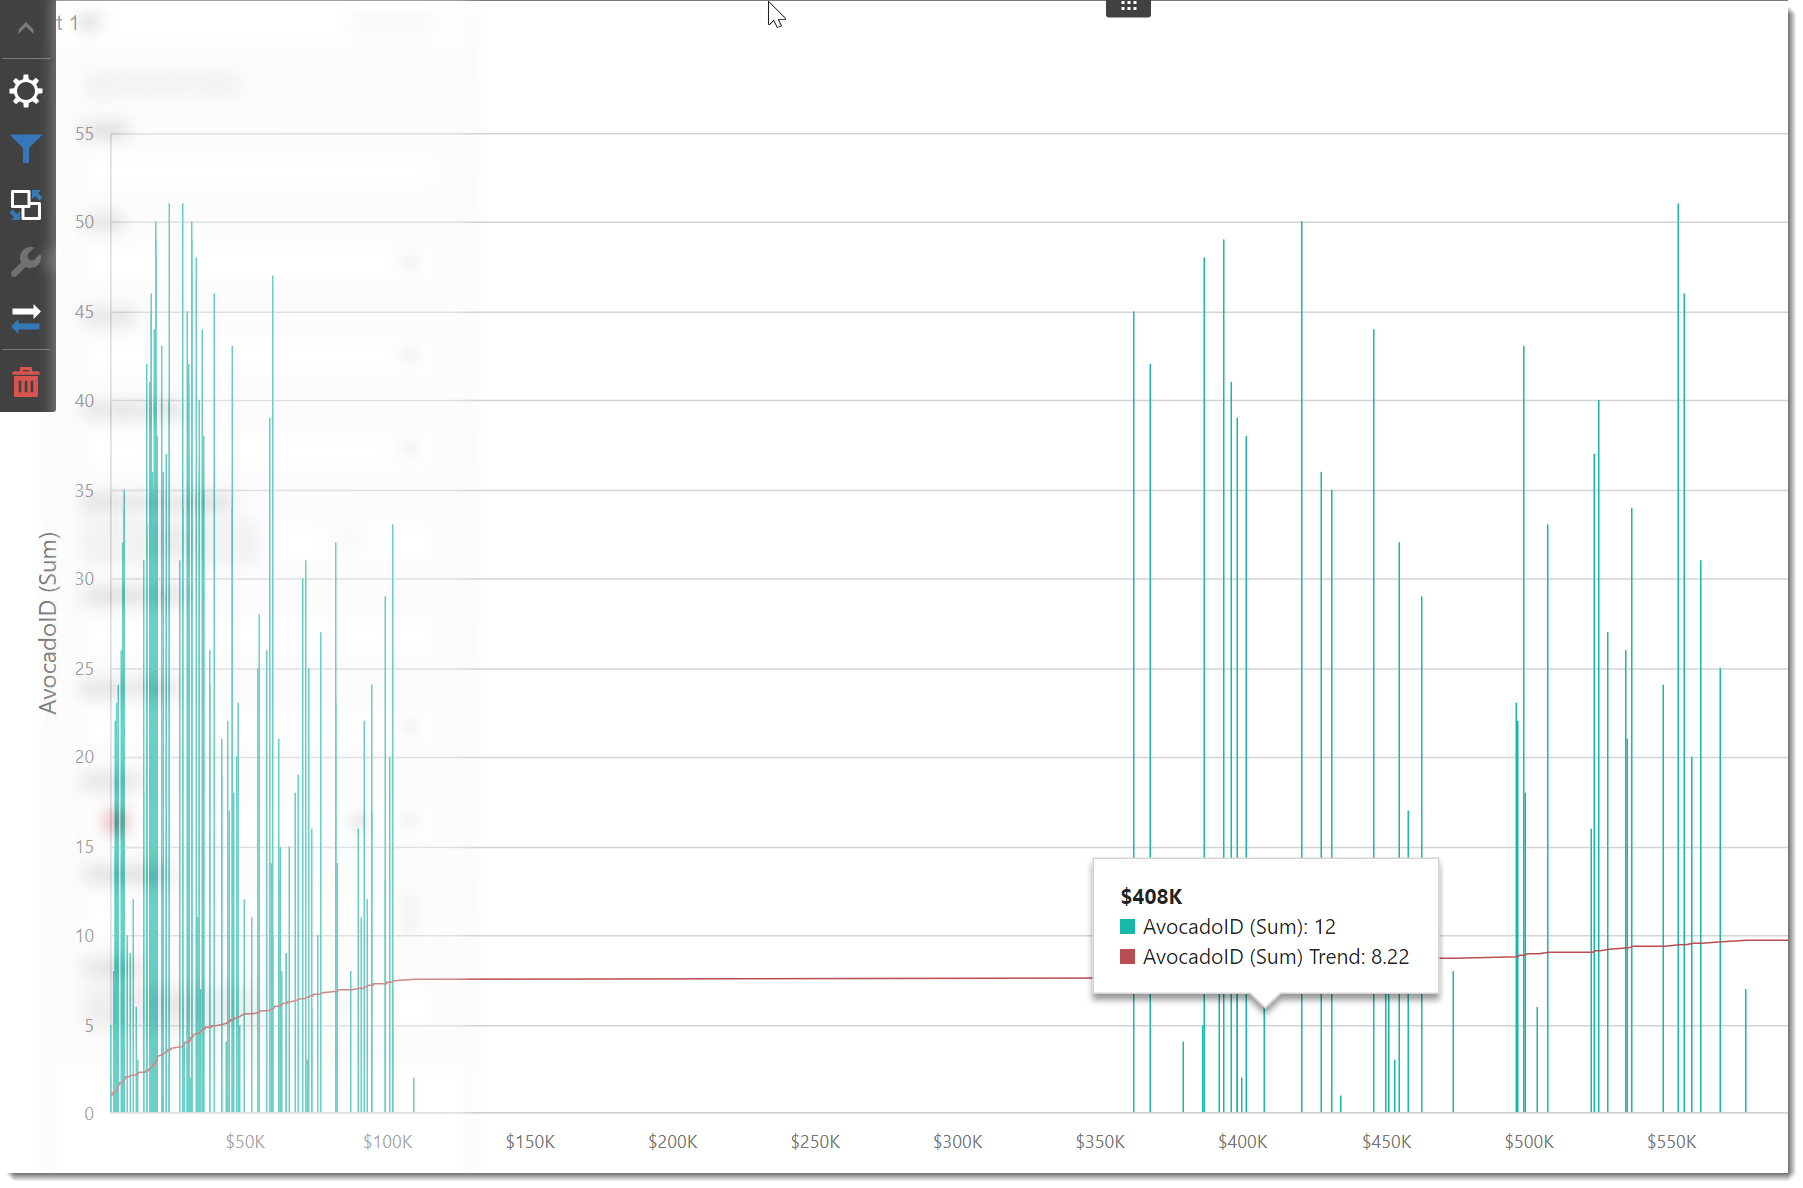
Trendlines
- Now, you have the ability to enhance your dashboard by adding a trendline. This feature allows you to visually analyze any trends that are present in your data.
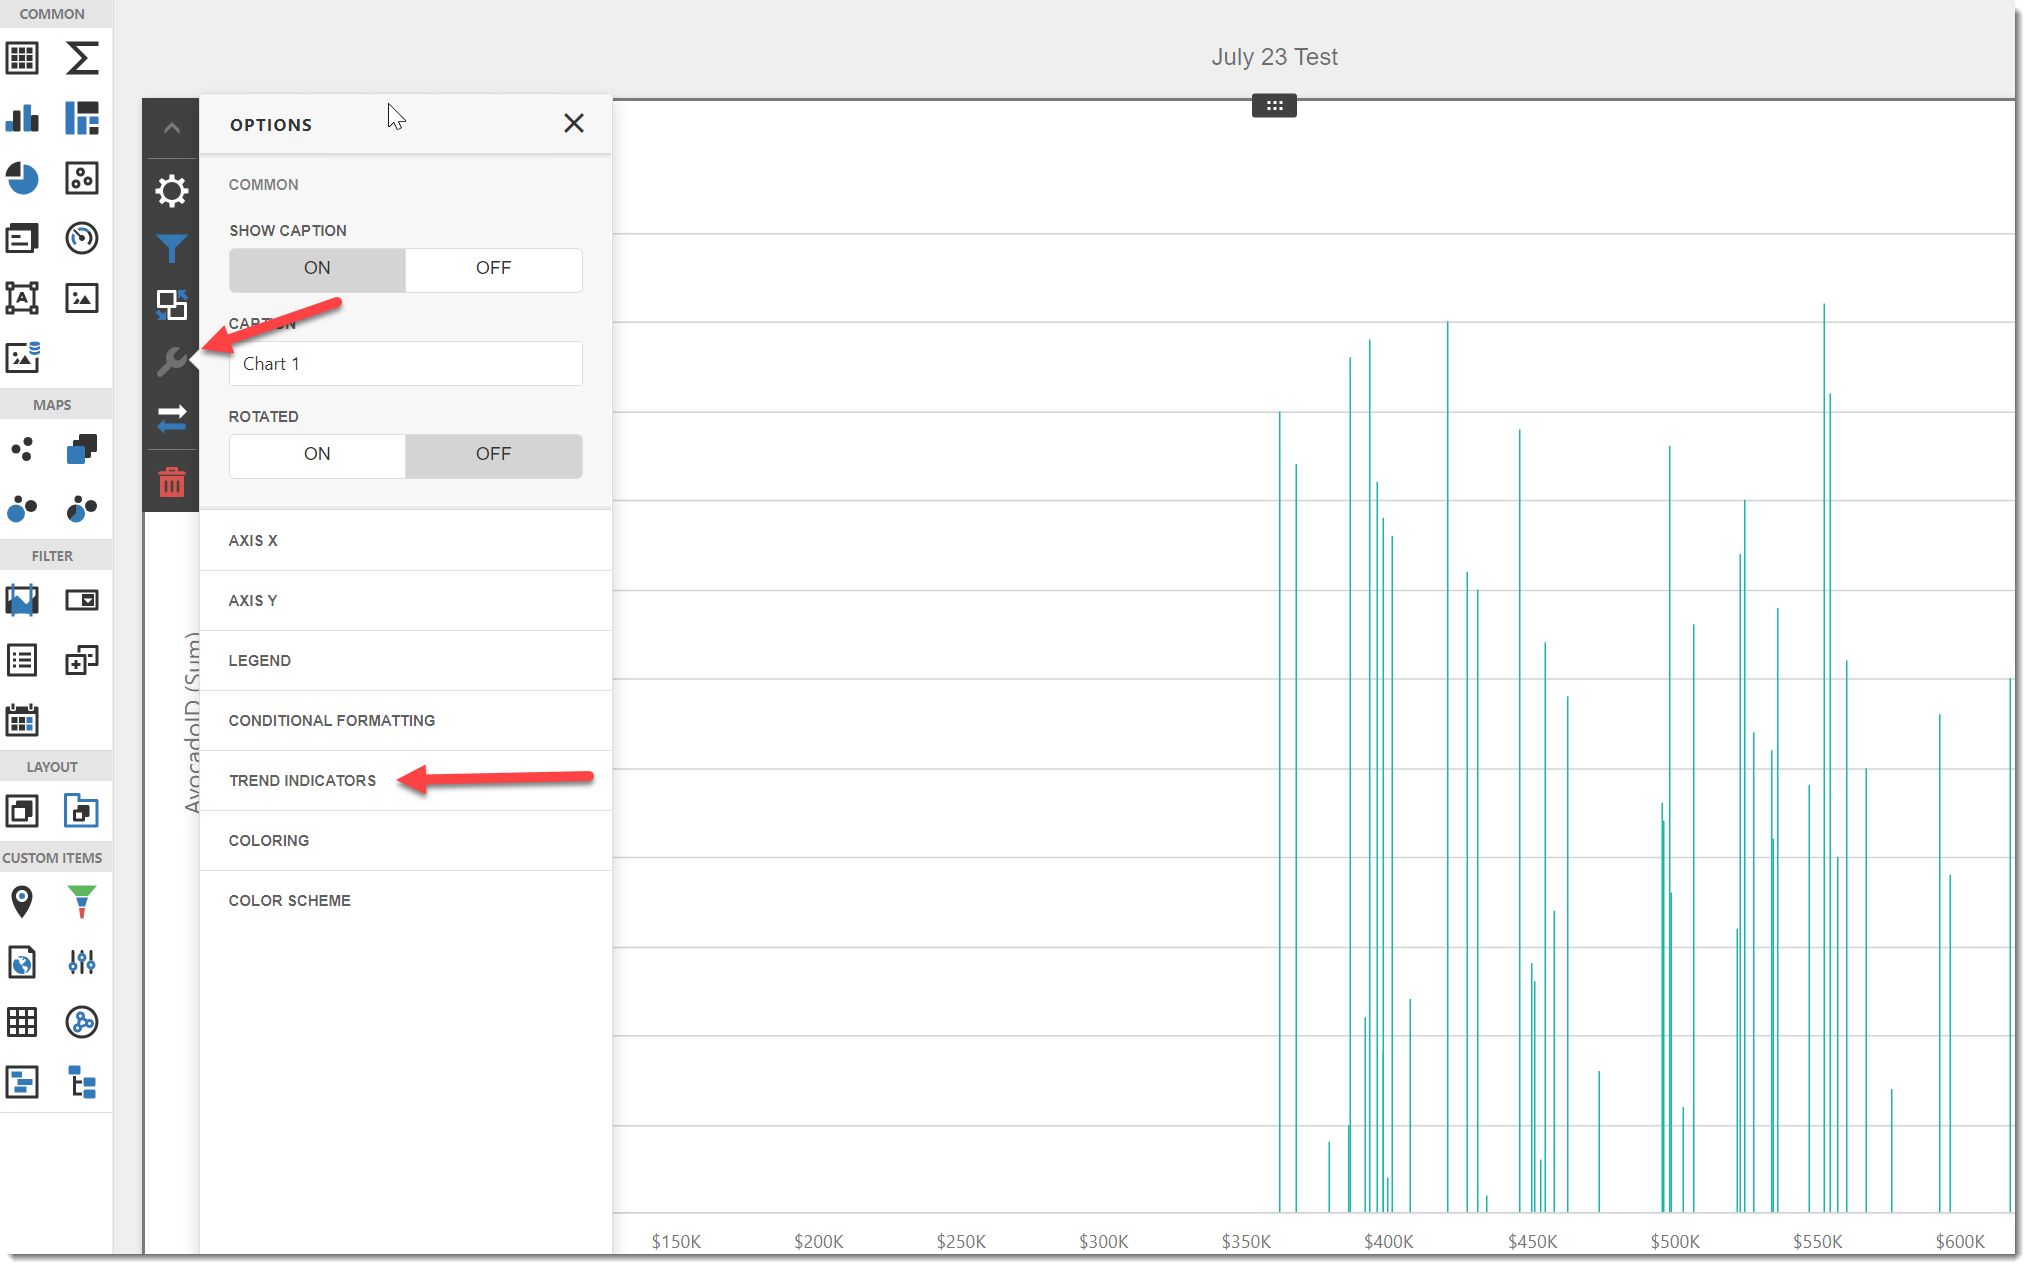
- After creating a dashboard, under Options, select Trend Indicators.
- After selecting the (+), a pop-up will appear where you can add your trendline.
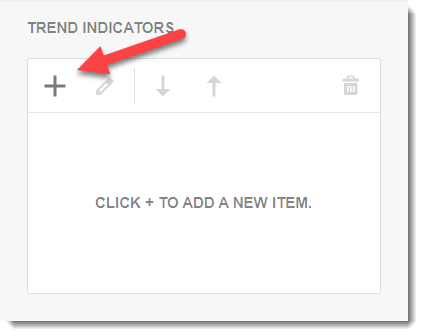
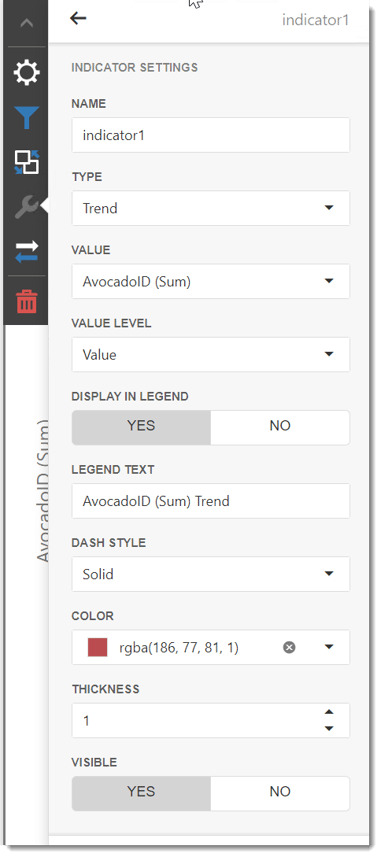
- Here, you can find your Trend Indicator settings.
- Name: Give your trendline a name.
- Type: Select if you would like your line to be a trendline, or a regression line.
- Value: Select your value.
- Value Level: Select your value level.
- Display in Legend: Here, you have the option to choose whether or not you want the trendline to be displayed in the legend.
- Legend Text: You have the option to modify your legend text.
- Dash Style: Here, you can decide if you would like your trendline to be solid, dotted, or dashed.
- Color: Select or alter the color of the trendline.
- Thickness: Here, you can change the thickness of the trendline.
- Visible: Select whether or not you would like the trendline to be visible.
Renaming a data source

- To rename a data source, click the three dashes in the top left corner. This brings up the dashboard menu.
- Click on Data Sources.
- Once your data source is displayed, you can hover over it to select the rename button.
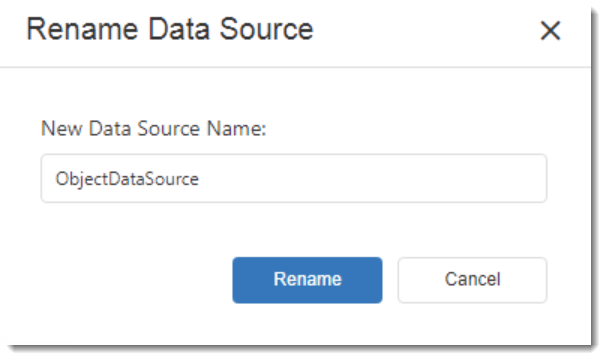
- This box will pop up, allowing you to rename your data source with ease.
- Once you selected a Dataset for your dashboard, click Edit Dashboard.
- Decide on which type of graph best suits the data you are going to be reporting on.
In this section, it is recommended to know what is the exact data analysis you want to demonstrate. We recommend asking questions and answer them with the chart.
- Click on the Visualization data you would like to use.
Note: You can now make changes to the appearance of the dashboard with new features such as:
- The ability to set a dashboard Fixed Width and Height.
- The ability to specify a color scheme's opacity level.
- The ability to specify the color levels with an Alpha Channel from the Color Picker.
Set Fixed Width and Height:
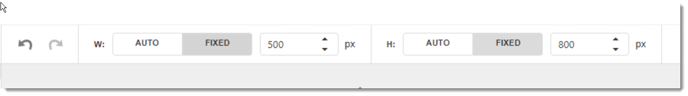
- To set a dashboard's fixed width and height, locate the bar above at the top of the dashboard.
- Select Fixed for the Width (W) and Height (H).
- Enter the size you would like in pixels.
- The fixed width and height are now set.
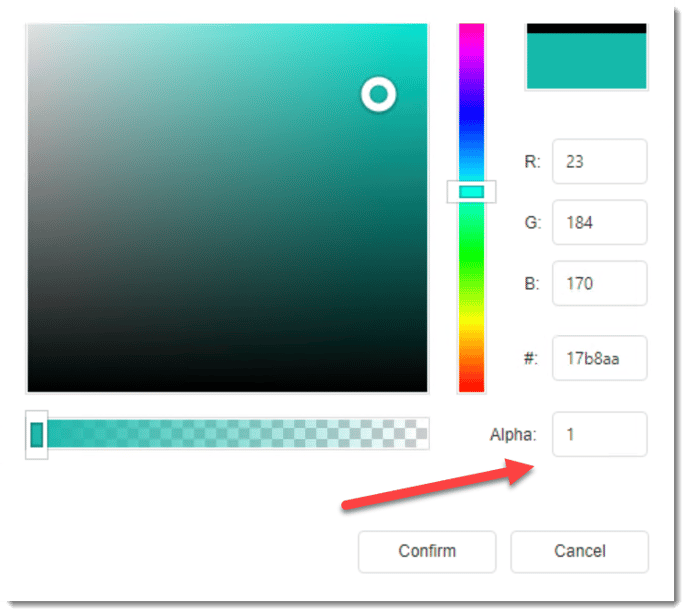
Specify the Opacity Level:
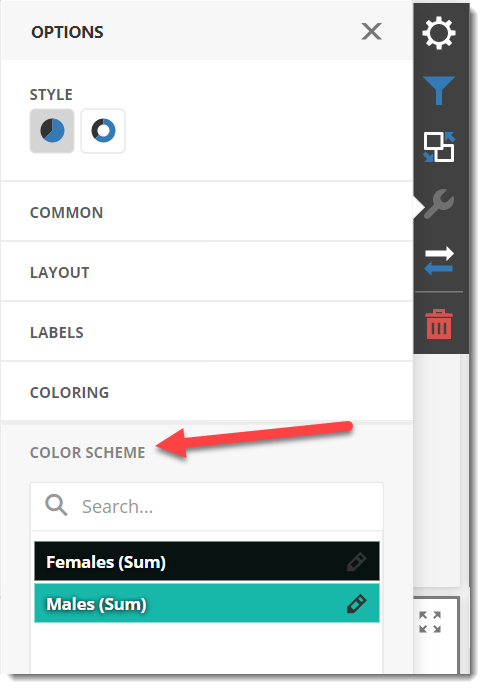
- To change the opacity level in your dashboard, click on Options followed by Color Scheme.
- Next, click on the pencil next to whichever color you would like to change the opacity level of.
- Under the color scale you will find a bar (see above) with a gradient scale. Here you can select the opacity level of any color on your dashboard.
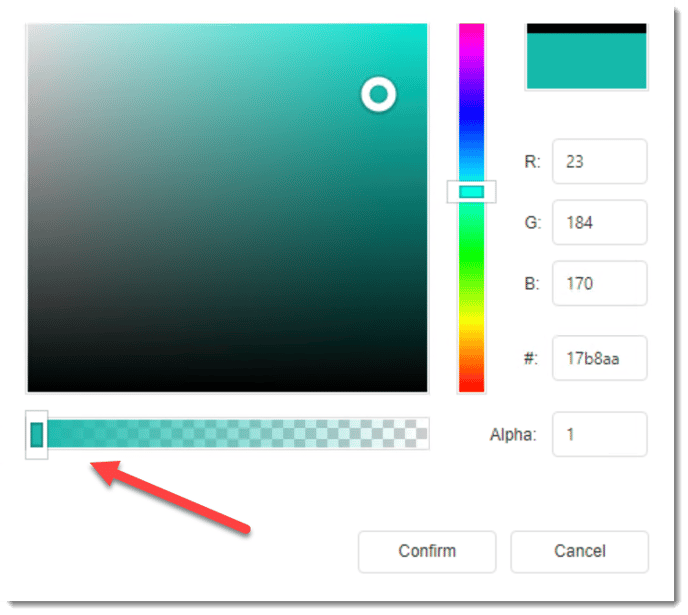
Specify the Color Levels with an Alpha Channel:
- To change the color values with an Alpha Channel, click on Options followed by Color Scheme.
- Next, click on the pencil next to whichever color you would like to change the color values of.
- Here, you will have the ability to alter the Alpha Channel and therefore change your color value.
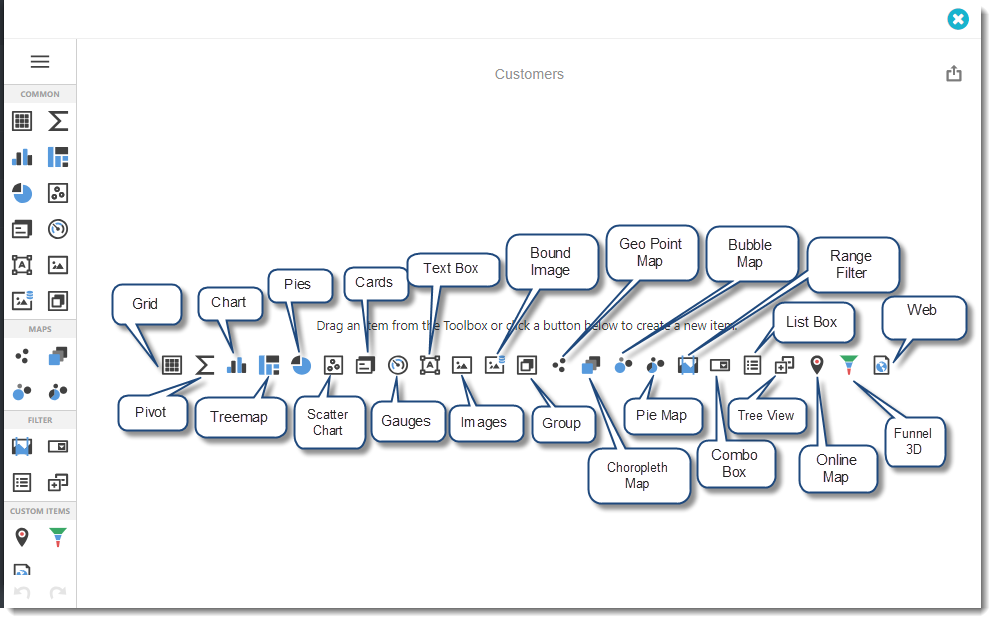
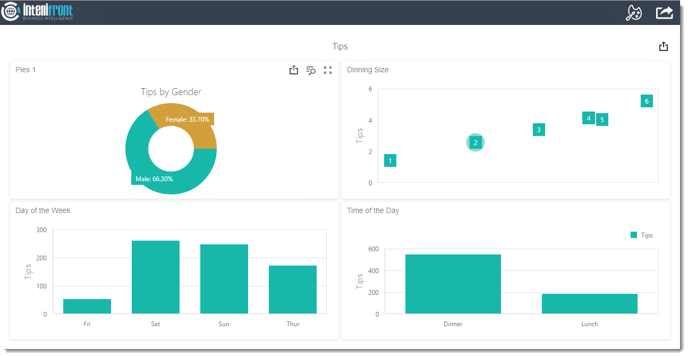
To manage each visual:
- Grid
- Pivot
- Chart
- Treemap
- Pies
- Scatter Chart
- Cards
- Gauges
- Text Box
- Images
- Bound Image
- Geo Point Map
- Choropleth Map
- Bubble Map
- Pie Map
- Range Filter
- Combo Box
- List Box
- Tree View
- Group
- Tab Container
- Online Map
- Funnel 3D
- Web
- Polar Chart
- Gantt Chart
Other functionalities:
Viewing a Dashboard
Note: You can now duplicate dashboards.
- Once a Dashboard is created, click the View button on its context menu.
- It will open a new tab with the Dashboard.
Set Theme
- Click Set Theme button to change the dashboards theme.

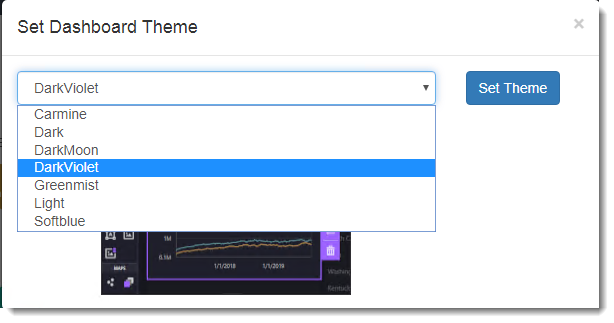
- Select a theme using the drop-down menu and click Set Theme.
Share a Dashboard
- Click the share button.

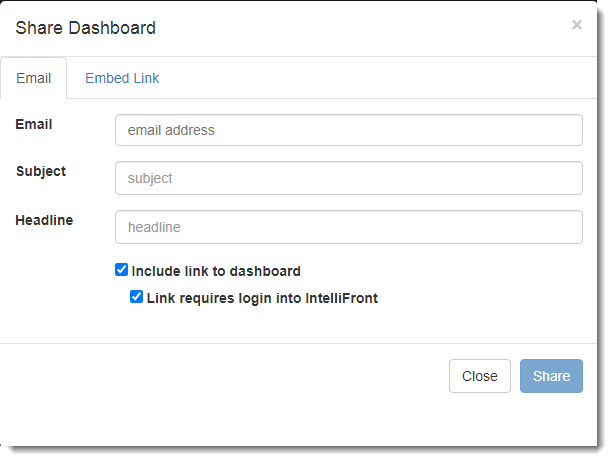
- Email: Enter the email address to share the Dashboard.
- Subject: Enter a subject for the email.
- Headline: Enter a headline for the email.
- Include link to the dashboard: Check this option to insert the link to the dashboard.
- Link requires login into Intellifront: Check this option to get a secure link to the dashboard.
- Click Share.
Embed Link
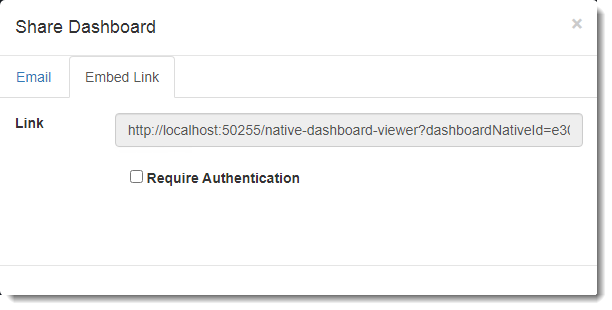
- Require Authentication: Check this option to generate a secure link for the dashboard.
Your dashboard has been shared successfully.
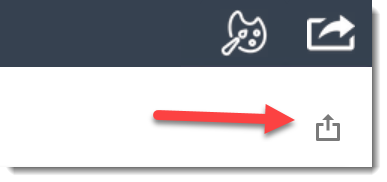
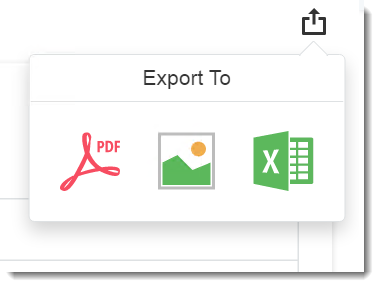
Export Dashboard
Clicking this option allows you to export your dashboard in the format of a PDF, an image, or an excel sheet.
For PDF:
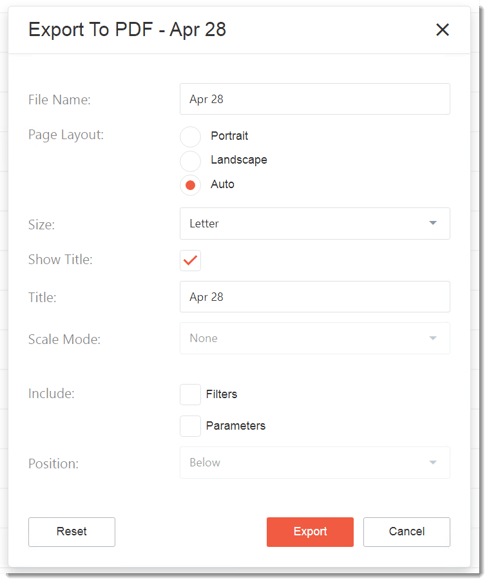
- Insert your File Name.
- Choose your Page Layout.
- Select your page Size.
- Check whether or not you would like to Show your Title.
- Enter your Title.
- Select your Scale Mode (if applicable).
- Check whether you would like to include Filters or Parameters.
- Select your Position (if applicable).
- Select Export.
Your dashboard will be exported.
For Image:
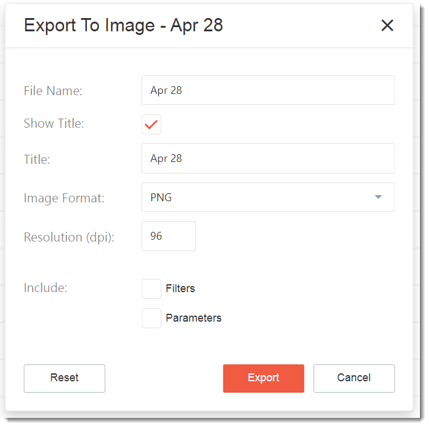
- Insert File Name.
- Check whether or not you would like to Show your Title.
- Enter your Title.
- Select your Image Format.
- Enter your Resolution (in dpi).
- Check whether you would like to include Filters or Parameters.
- Select Export.
Your dashboard will be exported.
For Excel:
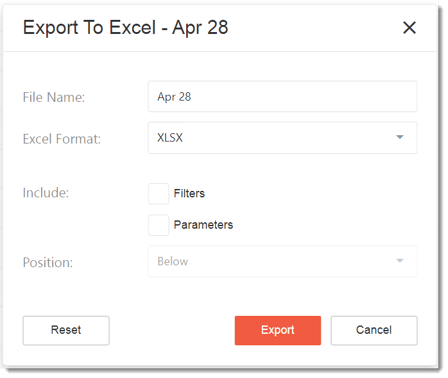
- Insert File Name.
- Select your Excel Format.
- Check whether you would like to include Filters or Parameters.
- Select your Position (if applicable).
- Select Export.
Your dashboard will be exported.
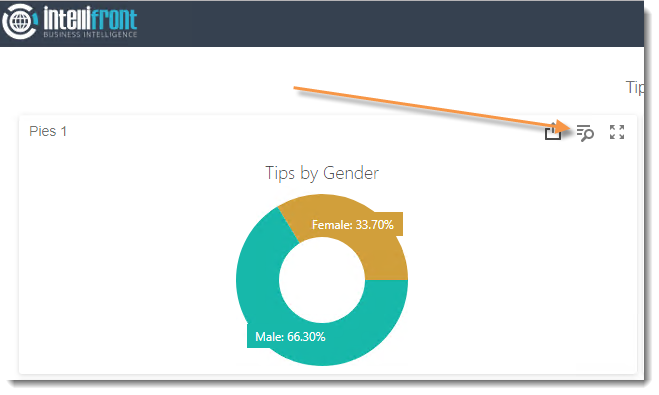
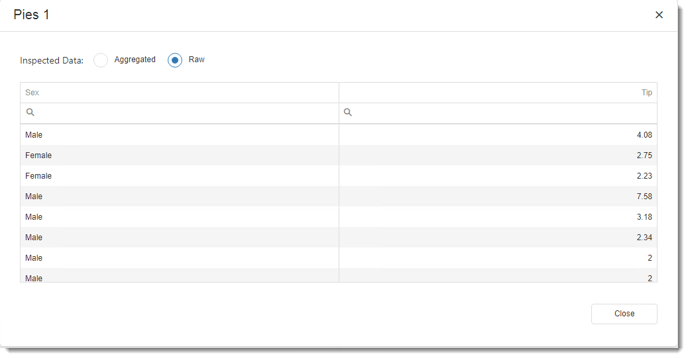
Inspect Data
You may view the aggregated and raw data that has been used for each dashboard visual.
- Click the Inspect Data button.