Reports, KPIs, Dashboards & More
IntelliFront BI™ streamlines your Data Analytics & Business Intelligence tasks, helping you save valuable time and resources. With its user-friendly browser-based admin module, you can easily create both static and real-time reports and share them securely with management and stakeholders in a centralized hub.
It is designed for on-premises implementation and offers advanced security features such as Active Directory Integration, Single Sign On & 2-Factor Authentication as standard. With its built-in Application Security, you can confidently collaborate and share reports with external users without compromising your security policies.Easy to Use
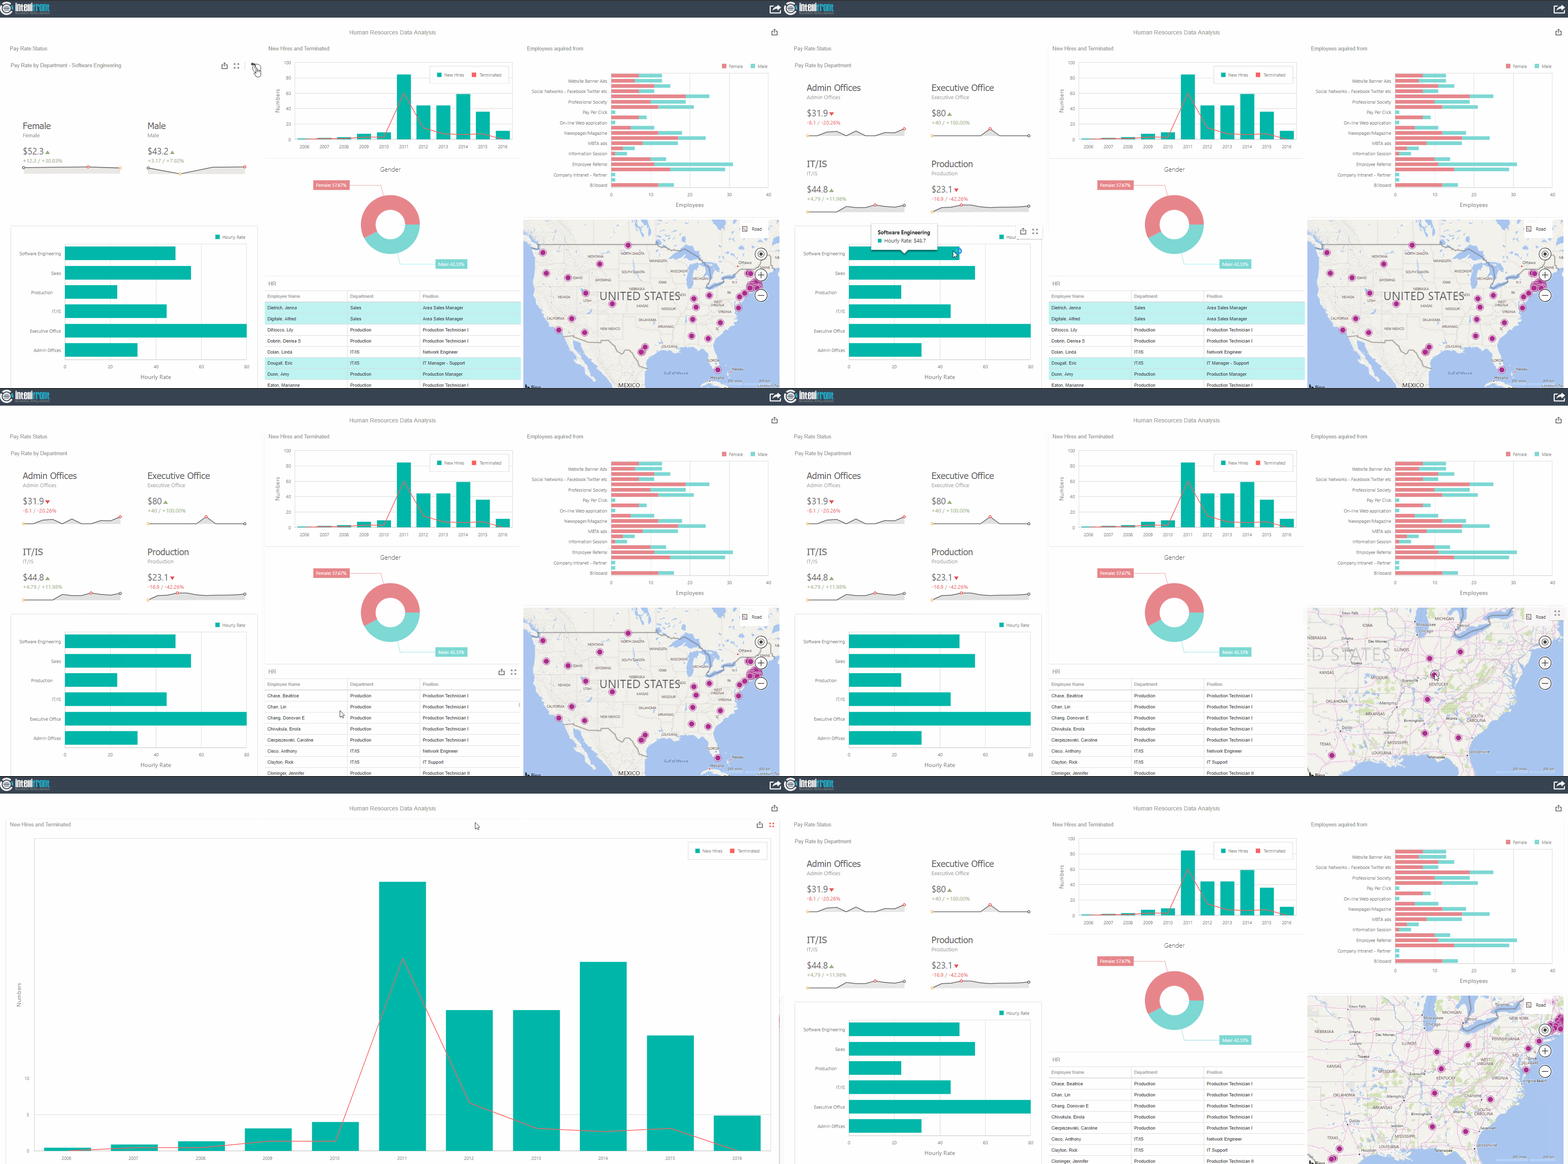
Create visually stunning and interactive reports and dashboards in real-time using a variety of visuals through our browser-based admin module. Designing and serving these reports has never been easier!
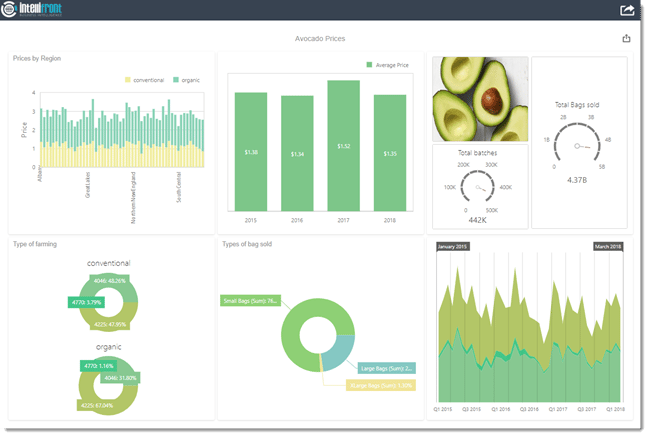
Experience the magic of creating the "Avocado Prices" dashboard in less than 5 minutes by simply clicking on the dashboard or the button below. It's that easy!
Popular Visuals
IntelliFront BI users have spoken and these are the top picks that will have you falling in love with your data all over again.
Grid
Pivot Table
Chart
A Chart Visual transforms complex data into a clear and concise visual, allowing for easy comparison and trend analysis. It's ideal for decision-making, presentations, and reports.
Tree Map
Pie
Pie charts effectively communicate complex data in an easy-to-understand format. They showcase percentage or proportional data with labeled categories. Use them to present financial, sales, or demographic data in an engaging way. Incorporate a pie chart in your next report to make your data more accessible.
Scatter Chart
A Scatter Chart visually represents correlation between two sets of data, making it an invaluable tool for identifying patterns and trends in data analysis. Consider using it to gain insights into related factors.
Map
An Online Map visually showcases data with geographical coordinates, making it perfect for businesses and organizations to display customer locations, sales territories, and points of interest. With customizable markers, labels, and layers, it provides a dynamic, interactive experience for the audience, bringing static data to life.
Funnel
A Funnel 3D Visual is a powerful tool for visually representing sequential data, providing depth and dimension to your message. Showcase the total amount of data associated with each stage and engage your audience with an informative and engaging representation. Don't settle for flat charts and graphs when you can bring your data to life with a Funnel 3D Visual.
Gauge
Gauges Visuals quantify data and provide easy-to-understand representations, identifying patterns and outliers for informed decision-making. They are essential for any data-driven organization.
Don't just take our word for it
Read what IntelliFront BI users say about their experience.
We are a charity with projects all around the world. Using IntelliFront BI from ChristianSteven, we are now (finally !) able to report visually, geographically mapping the locations and sizes of our projects.
We are also producing real-time data which assists our Projects team in the management of their projects. We are respond to high-level queries from our directors, and provide good, consistent data in moments, rather than the days which it took before.
The output from IntelliFront BI is fast, easy to create, and can be visually stunning – the only limit is our imagination !
On the rare occasions we get stuck trying to do something, the folks at ChristianSteven have been swift (and patient) in helping us to resolve everything to our satisfaction.
Everyone in our company has been very impressed by what we are now able to produce, so impressed in fact, that we are using IntelliFront BI to provide user-friendly data from some of our other systems, in addition to the one for which this was originally purchased.
The benefits IntellIFront BI has brought to our hospital Trust are many: The visual display of KPIs for business cases; the ability to monitor performance against CQUIN guidance (The Commissioning for Quality and Innovation framework); control of the reports and refresh rates without input from IT; user access control, including secure multi-user access; the transfer of some responsibility back to clinical teams; the ability to view specific data by wards; and more.
The overarching benefit of IntelliFront BI is to improve patient safety and, as Paul Pillai (EPMA System Manager for University Hospitals Sussex NHS Foundation Trust) always likes to say, "data saves lives".
Working with ChristianSteven has been a pleasure. They are friendly, cooperative, flexible and strive to meet our needs.
IntelliFront BI has improved our reporting management system. We can incorporate our own documentation templates for each report, categorize reports into functional groups, and provide dashboards and KPI's geared to each customer's needs.
Our users like the interface. We can organize our reports, dashboards and KPI's by groups which helps our users find the reports they need quickly.
Example Dashboards
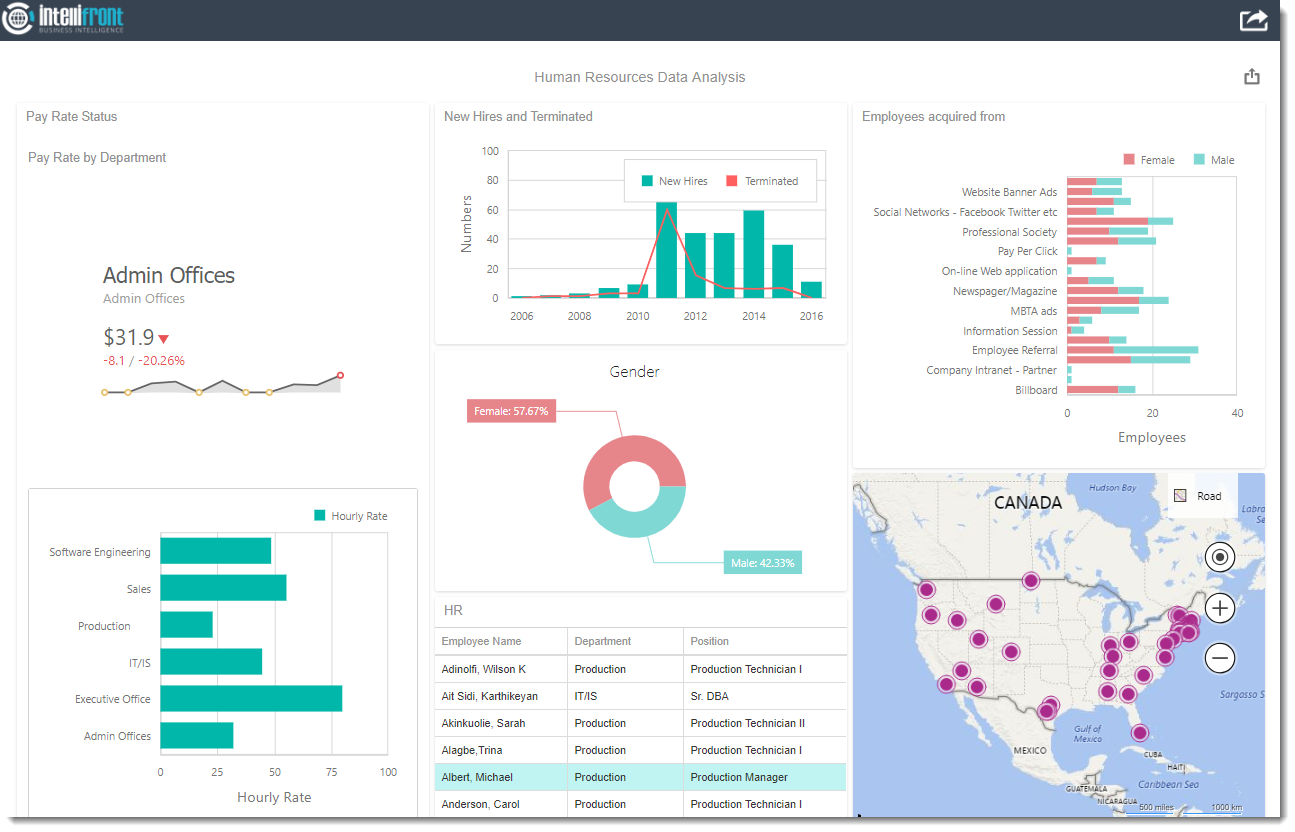
Explore the awe-inspiring dashboards and reports that can be effortlessly crafted with IntelliFront BI.
.png?width=1295&height=871&name=IFBI%20Dashboard%20(3).png)
.png?width=1295&height=871&name=IFBI%20Dashboards%20(4).png)
.png?width=1295&height=935&name=IntelliFront%20BI%20Dashboard%20(2).png)
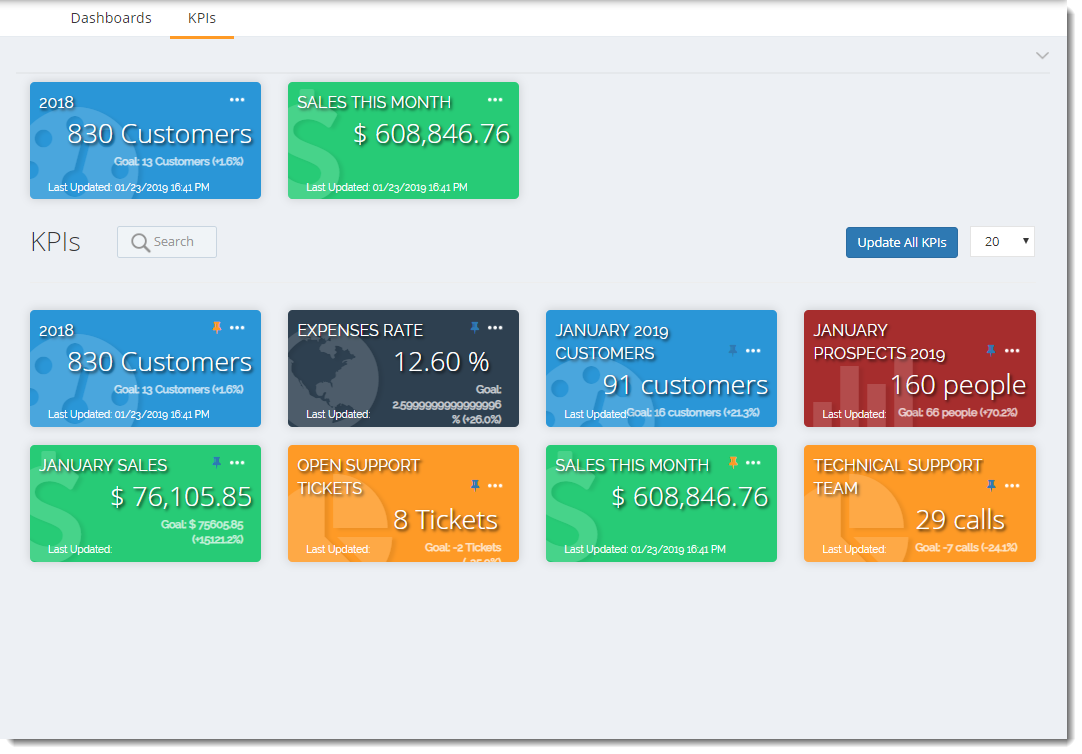
.png?width=1295&height=871&name=IFBI%20Dashboard%20(3).png)
.png?width=1295&height=871&name=IFBI%20Dashboards%20(4).png)
.png?width=1295&height=935&name=IntelliFront%20BI%20Dashboard%20(2).png)


Latest Releases
IntelliFront BI is continuously updated to ensure compatibility with all Windows Server and security updates. And to add new capabilities too!
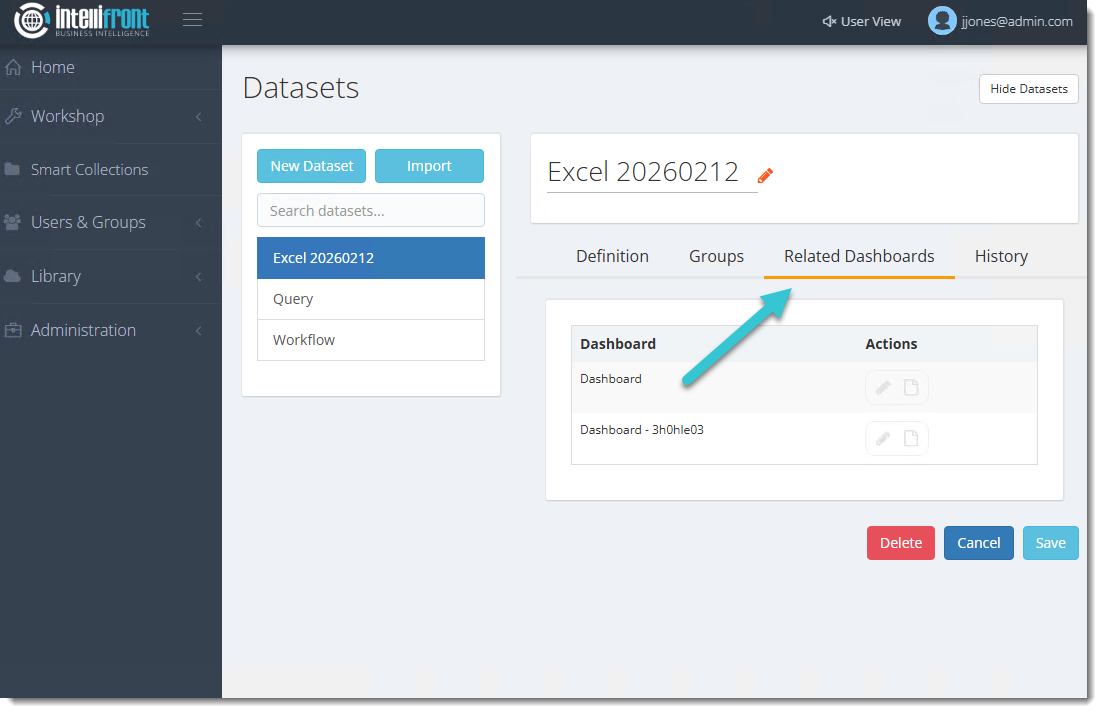
IntelliFront BI Release 20260218 Now Available
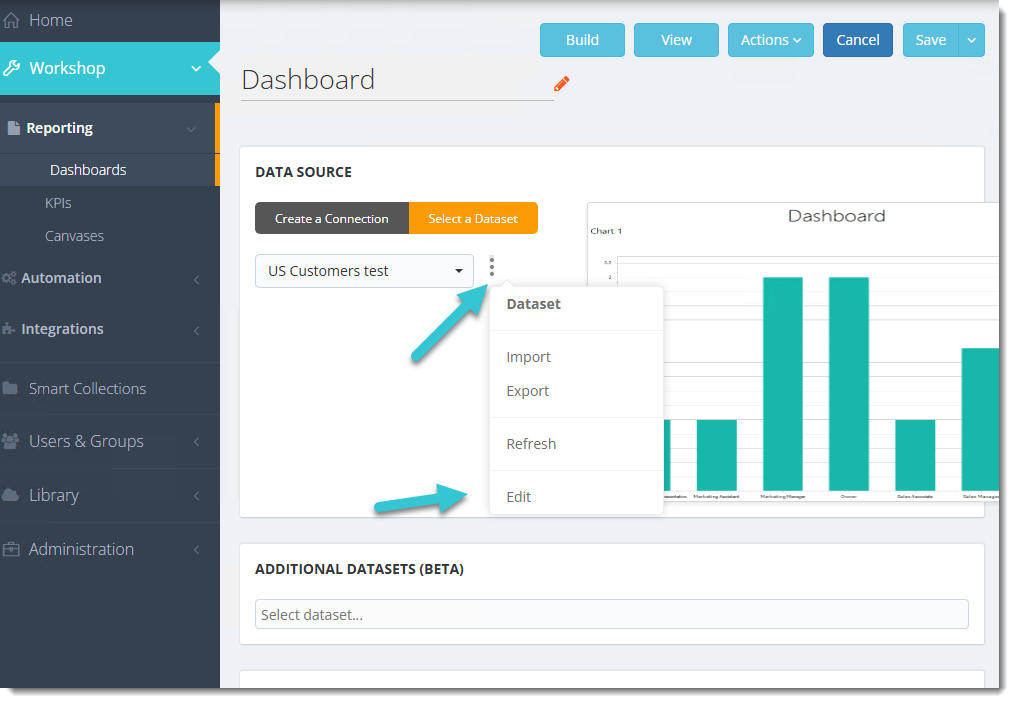
IntelliFront BI Release 20251203 Now Available
