Share this
by Christian Ofori-Boateng on Jul 22, 2019 8:00:00 AM
A data dashboard is an informative tool that helps you display, manage, and analyze your key performance indicators (KPIs). You can even customize a dashboard to meet your specific business needs. A dashboard connects to your files, services, and APIs, but displays all your data in a straightforward way for you to analyze and predict. If you have multiple data sources and a lot of data to process, a dashboard can make it so much easier for you to collect and analyze it all in one place.
How Do Dashboards Work?
The most effective dashboards answer essential questions about your business. They are designed for quick analysis and informational awareness. If you brainstorm and identify your goals, you can design a very informative dashboard that will help you answer your business questions and track your goals. You can also make changes to your strategy based on how your KPIs are trending on your dashboard.
Why Should You Visualize Your Data on a Dashboard?
If you have multiple key performance indicators and metrics to track, it can quickly get overwhelming to track them and communicate with the rest of the organization. Dashboards use raw data from multiple sources, spreadsheets, and databases to create line and bar charts so that you can easily understand and analyze trends in your data set. You can also share these dashboards with other users, customers, or vendors, and they become an excellent communication tool.
Presentation of Your Data
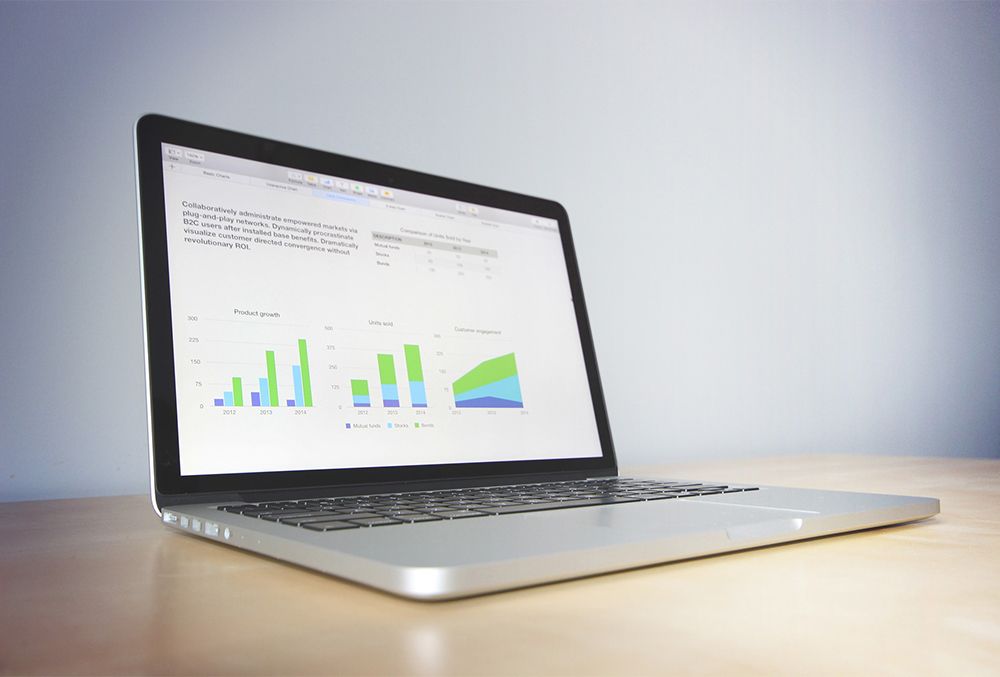
You can design your dashboards to help your executives and senior leaders make informed decisions and establish targets. You can also adjust your goals and understand why a particular trend is happening and what to do about it using a well-designed dashboard. Data is visualized on a dashboard as tables, line, and bar charts so that users can track the health of their business against their goals.
Easy to Analyze
Dashboards display KPIs and metrics using different visualizations techniques that are available within the software. You can create your own custom visuals to enhance the capability of your dashboard. Useful dashboards utilize colors, symbols, and visualizations to highlight important data points, and allow you to scan a dashboard and get the information you need quickly. Even if you have limited technical expertise, a dashboard makes it easy for you to analyze and make informed decisions about your business.
Overall, a dashboard is a pretty handy tool that can make your business intelligence workspace more organized and streamlined. Take your time to invest in a good dashboard software, and you can design dashboards to satisfy your business needs.

No Comments Yet
Let us know what you think