Share this
by Christian Ofori-Boateng on Sep 4, 2018 10:00:00 AM
Business Intelligence dashboards have become quite essential for large corporations to analyze data and create data-based solutions. Most BI software tools are easy-to-use for business analysts and empower you to crunch a large amount of data. Furthermore, business intelligence dashboards provide the easiest way to infer insights and create business value that you can share across the organization.
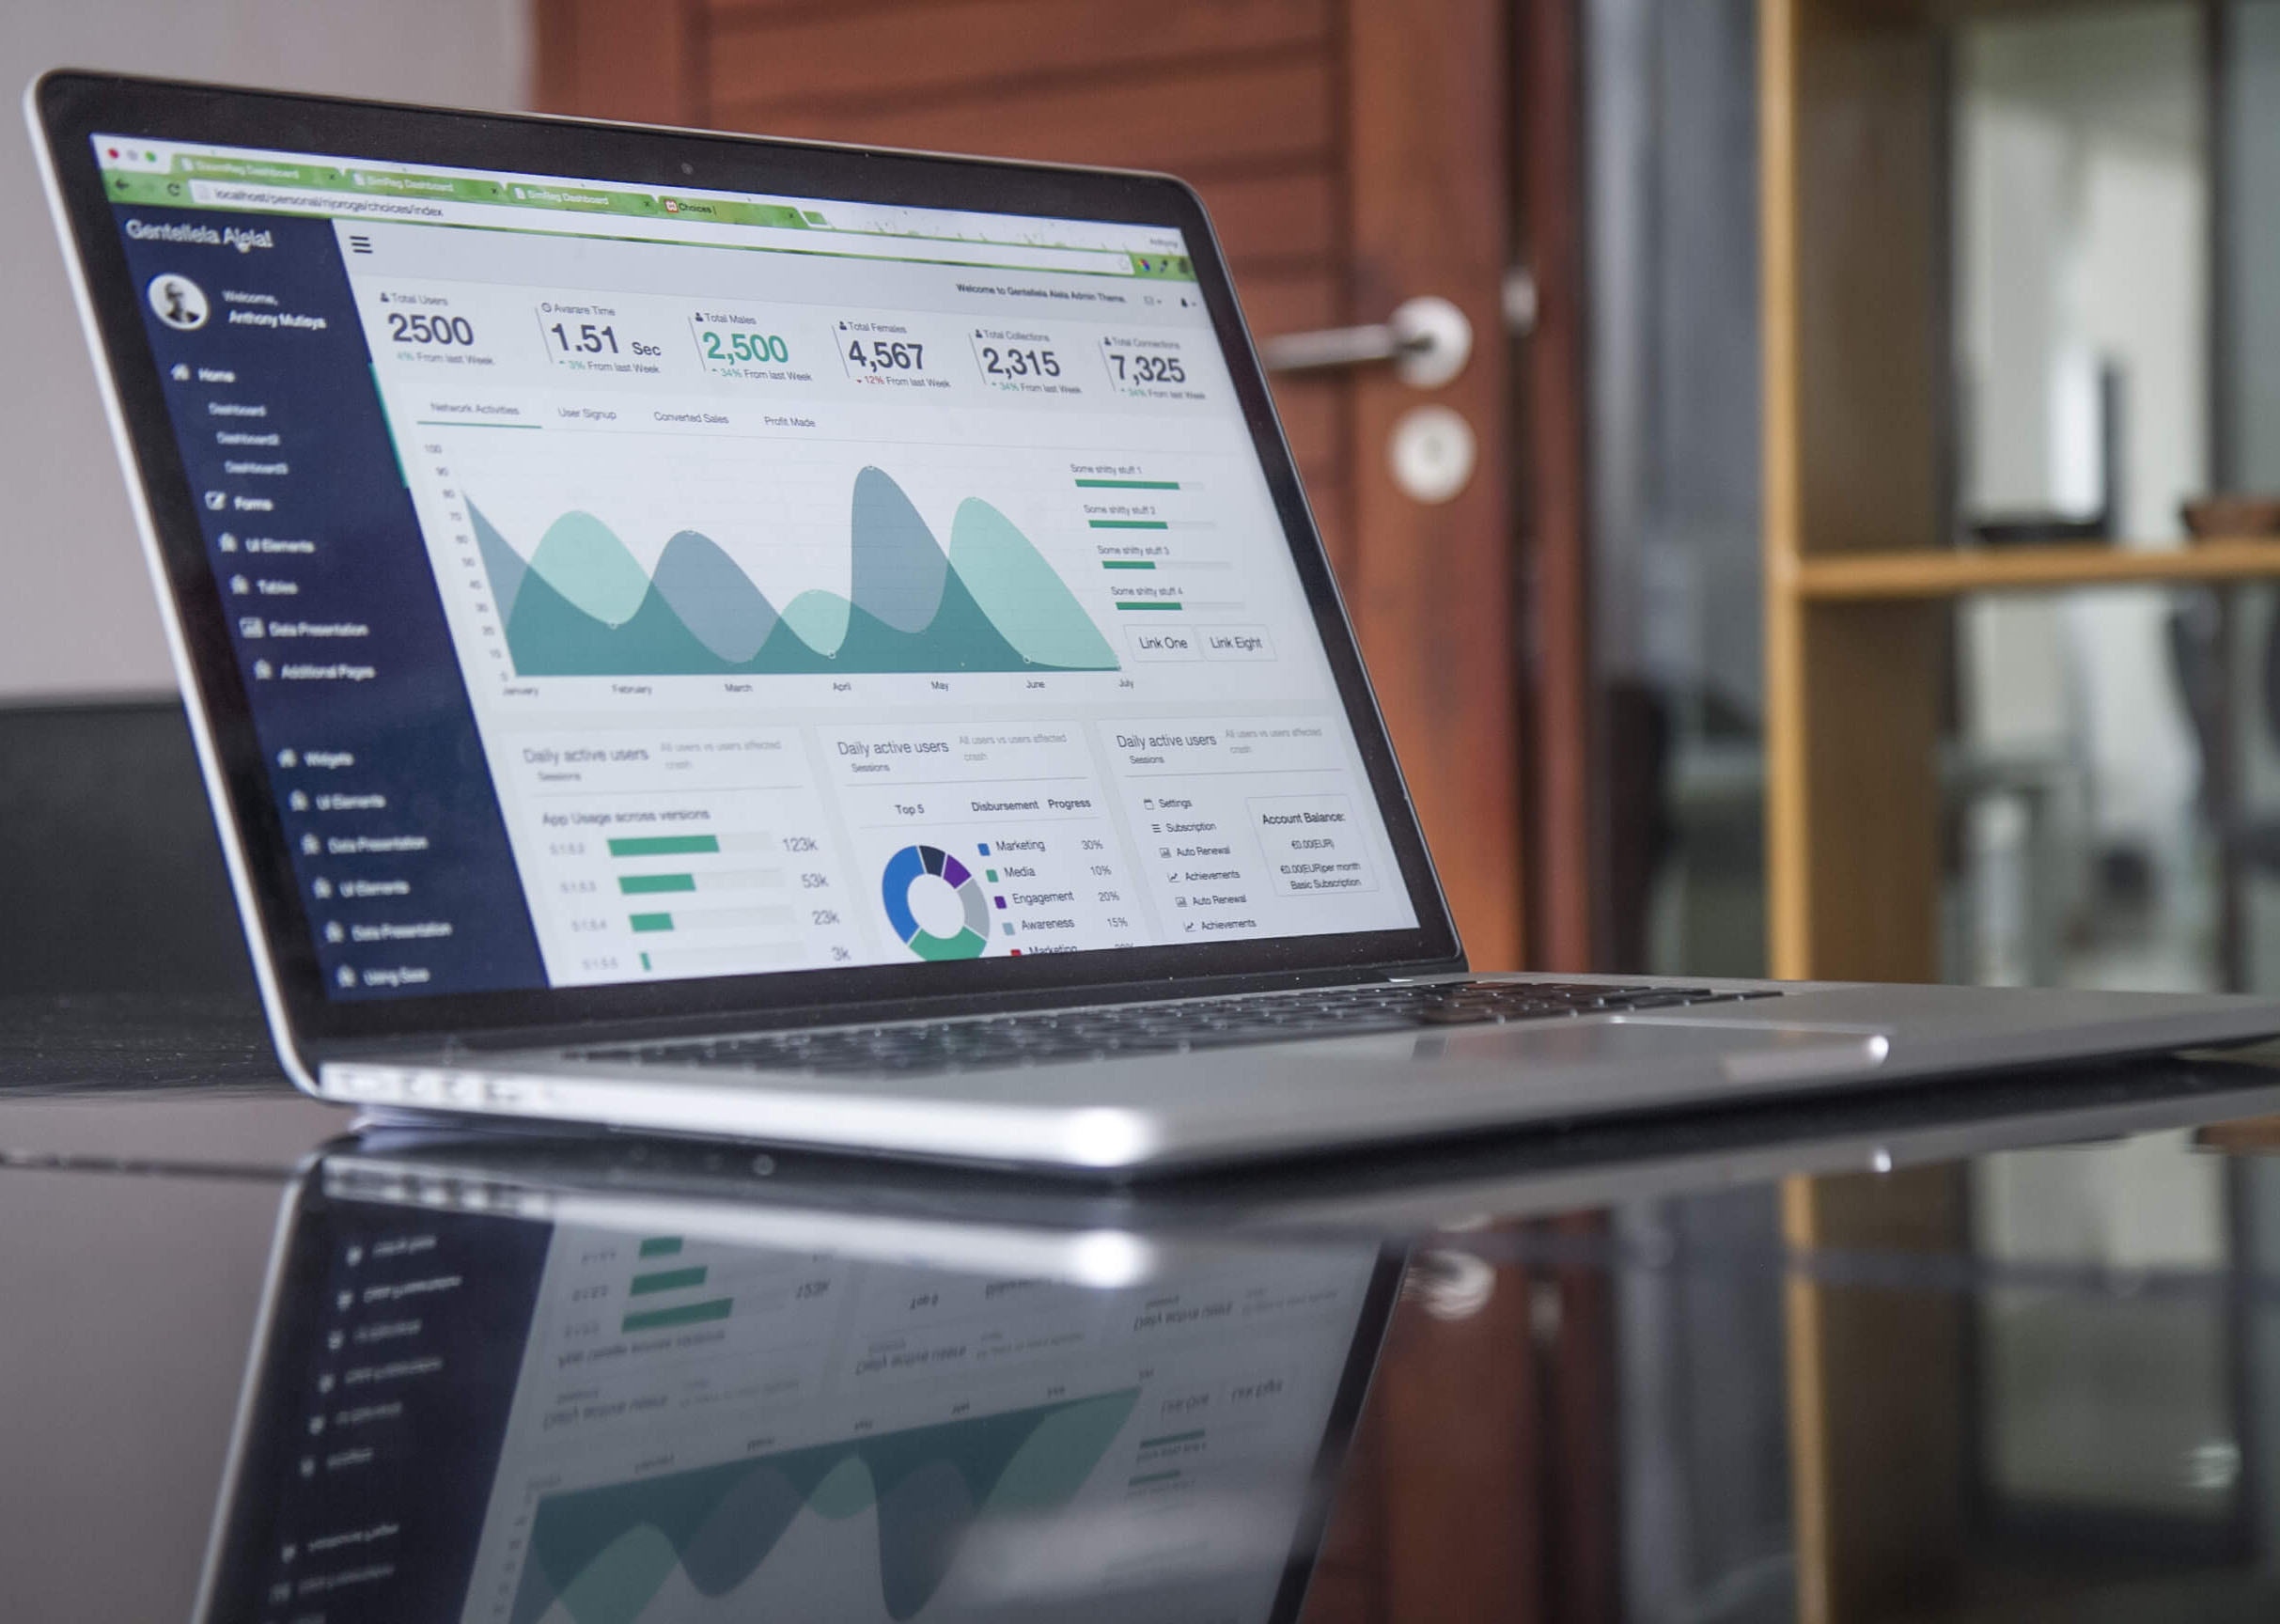
When you process all the data, you can present it for consumption on a business intelligence dashboard. Such dashboards not only help with data analysis, but they also help in keeping different departments of an enterprise on the same page. From metrics displays to complex visualizations, a BI dashboard can become quite a handy tool for meetings and discussions within your company.
Key Elements of a BI Dashboard
Executives can collect insights from BI dashboards and reports with complete visibility into the entire organization. Additionally, analysts will be able to probe deeper into complex data for more insights and important business correlations. A great business intelligence dashboard is the most productive tool to visualize your business data effectively. However, it should be easy to integrate into your existing systems.
When you design your BI dashboard, you need to ensure that you can fit all the important data metrics onto a single screen. If you have multiple measures, you need to prioritize a few placed at the top of your BI dashboard. Too many metrics can dilute the message and may lead to analysis paralysis.
Multiple users will have different uses for your BI dashboard. Some may be interested in a high-level view of metrics, and others may want to dig deeper for further analysis. An important feature of a BI dashboard is for the user to be able to drill down into specific data if and when required.
Needless to say, your BI dashboard’s data should refresh at desired and frequent intervals such that updated data is always available for consumption. Correct dashboard reporting leads to intelligent decision-making.
Examples of Various BI Dashboards
Different departments within your organization can utilize business intelligence dashboards. Moreover, you can use it for analysis of your products and comparing them to their competition. Your sales department is another area where a BI Dashboard can become quite handy in improving sales and prioritizing resources. Additionally, dashboards can also track customer and employee satisfaction.
IntelliFront BI is ChristianSteven Software’s Business Intelligence tool that can consolidate all your dashboards, reports and KPIs on a single easy-to-use portal. If you have already invested in technologies such as SSRS, Power BI or Crystal Reports, IntelliFront BI will help you merge all your reporting in one place for ease-of-use and low-cost maintenance. You can repurpose all your business intelligence assets by using IntelliFront BI and create a portal for all your users.

No Comments Yet
Let us know what you think