Share this
How the BI Continuum Helps the CIO Address Operational Efficiency. Part 1 of 3
by Christian Ofori-Boateng on Feb 16, 2018 12:00:00 AM
The BI Continuum™ is a framework used by ChristianSteven Software to describe audiences and their respective needs that a CIO must address as part of an enterprise BI strategy. It’s a spectrum of dis-tribution and format possibilities ranging from “push” (from central sources) at one end to “pull” (by end-users) at the opposite end.
-
What is the goal of Business Intelligence?
-
What keeps a CIO up at night? How does this relate to you?
-
Who are the audiences for BI and what do they need?
- Introduce the BI Continuum- how is it mapped to different audiences?
-
What are the 8 important characteristics of the BI platform?
-
How do you get started or advance your journey?
Before we get started let's understand what is meant by Business Intelligence. I choose to use a definition from CIO magazine which states: "Business Intelligence, or BI, is an umbrella term that refers to a variety of software applications used to analyze an organization's raw data. BI as a discipline is made up of several related activities, including data mining, online analytical processing, querying and reporting."
What is the goal of Business Intelligence?
What keeps the CIO up at night?
- The CIO's IT team wastes too much time performing manual BI processes to bring together information for reporting, analysis and insight
- IT cannot keep up with the current BI requests posed by users inside and outside of the enterprise-employees, partners and customer
- It is difficult to get the right information so that the enterprise can make the right strategic and operational decisions.
- It can be challenging to have the right timely information to remain compliant and adhere to regulations.
- The CIO feels tremendous pressure to ensure that the organization is not making investments in technology the will become obsolete.
Who are the audiences for BI and what do they need?

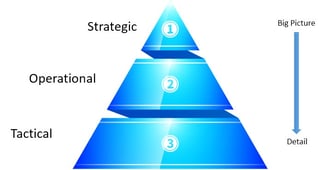
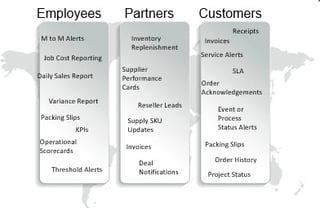
- Employees. At the Management or Board level, BI is used to make strategic decisions. At the Operational level BI will be used to make better operational decisions including re-engineering or improving business processes. At the individual level BI will be used to provide insight and vital information for that role or function in the enterprise. These are often executive KPIs and scorecards, regional and individual sales reports.
- Partners may include suppliers or commercial partners such as resellers. An example of the use of BI would be automatically distributing the latest product codes to vendors weekly so that they can invoice using the most up to date SKU numbers. Often there are thousands of SKUs so distributing manually would be impractical. Another example could be an extraction of inventory data that is sent to suppliers daily, so that they can order additional suppliers if inventory runs low.
- Customers are frequent consumers of BI. Customers receive invoices, critical alerts, notifications, and dashboards. In some cases customers log into their vendor's portal to view a dashboard of their service status, or view previous orders. Other business customers use BI to track the progress of vendor's projects. Some customer BI happens in the back end, such as processing orders or printing off a packing slip to go into their order boxes.
To learn more about the BI Continuum and receive your own downloadable PDF version of the BI Continuum Infographic, please click the button below.
Share this
- Business Intelligence (181)
- PBRS (180)
- Power BI (164)
- Power BI Reports (159)
- Power BI Reports Scheduler (152)
- IntelliFront BI (119)
- Microsoft Power BI (106)
- Business Intelligence Tools (81)
- Dashboards (81)
- Data Analytics (81)
- Data Analytics Software (80)
- Data Analytics Tools (79)
- Reports (79)
- KPI (78)
- Crystal Reports (37)
- Crystal Reports Scheduler (36)
- SSRS (33)
- CRD (25)
- SSRS Reports (25)
- SSRS Reports Scheduler (25)
- SSRS Reports Automation (23)
- Tableau (15)
- Tableau Report Automation (13)
- Tableau Report Export (13)
- Tableau Report Scheduler (12)
- ATRS (10)
- Crystal Reports Server (10)
- Tutorial (8)
- Automated Tableau Workflows (7)
- Power BI Report Scheduler (7)
- Tableau report (7)
- Crystal Reports automation (6)
- Power BI report automation (6)
- Power BI to CSV (6)
- Power BI to Excel (6)
- Power BI Dashboards (5)
- business reporting portal (5)
- Schedule Tableau reports (4)
- Tableau scheduled reports (4)
- ATRS Release (3)
- Business Analytics (3)
- ChristianSteven (3)
- KPI software (3)
- KPIs (3)
- Power BI scheduling tools (3)
- Reporting (3)
- Tableau Automation Tools (3)
- Tableau user permissions (3)
- business intelligence for finance department (3)
- business intelligence reports (3)
- tableau dashboards (3)
- BI, data exploration (2)
- Best Tableau charts (2)
- Bi dashboard (2)
- CRD software (2)
- Data-driven scheduling (2)
- Dynamic Power BI reports (2)
- PBRS Release (2)
- Report automation (2)
- Self-Service Data Analytics Tools (2)
- TSC API Integration (2)
- Tabcmd Scripting (2)
- Tableau charts (2)
- Tableau financial reporting (2)
- best tableau dashboards (2)
- bi dashboard solution (2)
- business intelligence software (2)
- crystal reports software (2)
- data analytics solutions (2)
- key performance indicators (2)
- power bi email subscriptions (2)
- power bi refresh (2)
- scheduling Power BI reports (2)
- share power bi reports (2)
- tableau extensions (2)
- tools for business intelligence (2)
- Advanced DAX Power BI (1)
- Automated report delivery (1)
- Automated reporting trigger (1)
- CRD automation features (1)
- Conditional report distribution (1)
- Conditional report generation (1)
- DAX optimization techniques (1)
- Data Driven Schedules (1)
- Data Visualization Skills (1)
- Dynamic report generation (1)
- Free Tableau License (1)
- GH1 (1)
- Power BI calculation groups (1)
- Scheduled report distribution (1)
- Static Power BI Report (1)
- Tableau Public Projects (1)
- Tableau access levels (1)
- Tableau financial dashboard (1)
- Tableau for Students (1)
- Tableau for finance (1)
- Tableau guide (1)
- Tableau images (1)
- Tableau permissions (1)
- Tableau server multi-factor authentication (1)
- Types of Tableau charts (1)
- ad-hoc reporting (1)
- automated distribution (1)
- automation in power bi (1)
- batch reporting (1)
- benefits of automation in power BI (1)
- bi data (1)
- bi roi (1)
- business intelligence implementation challenges (1)
- centralized BI platform (1)
- construct bi reports with power bi (1)
- construction bi (1)
- creating tableau dashboards (1)
- crysyal reports distribution (1)
- dashboard software (1)
- data analytics business intelligence difference (1)
- data analytics product (1)
- data analytics techniques (1)
- databest practices (1)
- distribute power bi report (1)
- email power bi (1)
- enterprise bi server (1)
- enterprise bi software (1)
- enterprise reporting strategy (1)
- export tableau to Excel (1)
- hospital business intelligence (1)
- how to save tableau workbook (1)
- images in Tableau (1)
- incisive analytics (1)
- intuitive business intelligence (1)
- on-prem BI report (1)
- power BI exporting (1)
- power bi emails to share reports (1)
- power bi for construction project (1)
- power bi gateway (1)
- power bi healthcare (1)
- print power bi report (1)
- real estate business intelligence (1)
- reducing reporting noise (1)
- retail BI report (1)
- retail KPI (1)
- sap crystal reporting (1)
- sap crystal reports (1)
- save tableau workbook with data (1)
- schedule power bi (1)
- schedule power bi reports (1)
- scheduled power bi emails (1)
- scheduled reports (1)
- share power BI reports by email (1)
- share your Power BI reports as PDF (1)
- stories in tableau (1)
- tableau add-ons (1)
- tableau data export (1)
- tableau for Excel (1)
- tableau mobile (1)
- tableau mobile app (1)
- tableau multi-factor authentication (1)
- tableau plugin (1)
- tableau software (1)
- tableau story (1)
- tableau story example (1)
- tableau storytelling (1)
- tableau workbook (1)
- tableau workbooks (1)
- time intelligence DAX best practices (1)
- use drop box to share Power BI Reports (1)
- user-friendly analytics (1)
- what is Tableau (1)
- what is Tableau software used for (1)
- February 2026 (6)
- January 2026 (4)
- December 2025 (1)
- November 2025 (4)
- October 2025 (5)
- August 2025 (5)
- July 2025 (5)
- June 2025 (4)
- May 2025 (5)
- April 2025 (2)
- March 2025 (6)
- February 2025 (4)
- January 2025 (1)
- October 2024 (1)
- September 2024 (1)
- April 2024 (1)
- March 2024 (1)
- February 2024 (1)
- January 2024 (1)
- December 2023 (1)
- November 2023 (1)
- October 2023 (2)
- September 2023 (1)
- August 2023 (1)
- July 2023 (1)
- June 2023 (1)
- May 2023 (1)
- April 2023 (1)
- March 2023 (1)
- February 2023 (1)
- January 2023 (1)
- December 2022 (1)
- November 2022 (1)
- October 2022 (1)
- September 2022 (1)
- August 2022 (1)
- July 2022 (1)
- June 2022 (1)
- May 2022 (1)
- April 2022 (1)
- March 2022 (1)
- February 2022 (1)
- January 2022 (1)
- December 2021 (1)
- November 2021 (1)
- October 2021 (2)
- September 2021 (1)
- August 2021 (2)
- July 2021 (1)
- June 2021 (4)
- May 2021 (5)
- April 2021 (3)
- March 2021 (2)
- February 2021 (2)
- January 2021 (2)
- December 2020 (2)
- November 2020 (2)
- September 2020 (8)
- August 2020 (3)
- July 2020 (5)
- June 2020 (11)
- May 2020 (2)
- April 2020 (3)
- March 2020 (2)
- February 2020 (5)
- January 2020 (7)
- December 2019 (9)
- November 2019 (9)
- October 2019 (10)
- September 2019 (5)
- August 2019 (6)
- July 2019 (13)
- June 2019 (8)
- May 2019 (3)
- April 2019 (5)
- March 2019 (4)
- February 2019 (3)
- January 2019 (10)
- December 2018 (2)
- November 2018 (22)
- October 2018 (10)
- September 2018 (12)
- August 2018 (5)
- July 2018 (23)
- June 2018 (29)
- May 2018 (25)
- April 2018 (12)
- March 2018 (22)
- February 2018 (15)
- January 2018 (15)
- December 2017 (6)
- November 2017 (4)
- October 2017 (4)
- September 2017 (4)
- August 2017 (4)
- July 2017 (7)
- June 2017 (12)
- May 2017 (10)
- April 2017 (6)
- March 2017 (10)
- February 2017 (7)
- January 2017 (5)


No Comments Yet
Let us know what you think