Share this
by Alexandra Nicholls on Apr 4, 2026 10:30:00 AM
Data analytics software for businesses is no longer a nice-to-have. It is how teams turn scattered numbers into decisions they can defend.
When finance, operations, sales, and executive teams all depend on accurate reporting, the wrong platform creates delays, duplicate work, and confusion. The right one gives us a shared view of performance, faster answers, and cleaner decision-making.
In this guide, we'll explain what data analytics software for businesses actually does, which features matter most, what types of platforms fit different needs, and how to evaluate options without getting distracted by flashy demos. We'll also show where IntelliFront BI from ChristianSteven fits, especially for organizations that need interactive dashboards, KPI visibility, and enterprise-ready business intelligence.
What Data Analytics Software Does For Modern Businesses

At its core, data analytics software for businesses helps us collect, organize, analyze, and present information in a form people can use. That sounds simple. In practice, it changes how a company runs.
Instead of pulling numbers from spreadsheets, emails, and disconnected systems, teams can work from shared dashboards and trusted metrics. That means fewer debates about whose numbers are correct and more focus on what the numbers mean.
For large organizations, this matters even more. Different business units often define KPIs in different ways. A solid analytics platform gives us a central place to align definitions, compare results, and spot trends early.
IntelliFront BI fits here as a business intelligence and KPI dashboard platform designed to help organizations turn operational and strategic data into visual insights. On the IntelliFront BI product page, ChristianSteven positions it around dashboards, analytics, and business reporting visibility, not just static output.
For readers who want a product-specific overview and setup guidance, the IntelliFront BI knowledgebase is useful as a reference point.
How It Supports Faster Decisions And Clearer Reporting
Good analytics software shortens the distance between a question and an answer.
A sales leader can see which regions are slipping. An operations manager can spot delays in fulfillment. A CFO can compare actuals against targets without waiting for someone to rebuild a spreadsheet. The platform becomes the place where performance is visible.
That is why interactive dashboards matter. Filters, drill-downs, and role-based views help us move from a top-level KPI to the details behind it. And when users can answer routine questions on their own, analysts and IT teams stop becoming bottlenecks.
This is also where business intelligence tools differ from basic reporting tools. Reporting tells us what happened. Analytics helps us explore why it happened and what needs attention next.
Why Manual Reporting No Longer Scales
Manual reporting breaks down fast once the business grows.
More systems create more exports. More stakeholders create more custom views. More meetings create more last-minute requests. Soon, smart people spend their time copying data instead of analyzing it.
The issue is not just speed. It is consistency. Manual steps introduce errors, version confusion, and missing context. One team may calculate margin one way while another team uses a different formula.
That's why data analytics software for businesses has become essential. It creates a repeatable reporting structure with shared logic, common metrics, and easier access to insight.
For enterprise teams, that shift affects real business outcomes:
- Finance can monitor revenue, margin, and forecast variance
- Operations can track throughput, inventory, and service levels
- Sales can watch pipeline movement and regional performance
- Executives can review company-wide KPIs from one place
When reporting demand increases, manual workflows don't stretch. They snap.
Core Features To Look For In A Business Analytics Platform
Not all analytics tools solve the same problem. Some are built for visualization. Some focus on modeling. Some serve embedded product analytics. For enterprise buyers, feature lists can get noisy fast.
We've found it helps to focus on the capabilities that affect day-to-day business use most.
Dashboarding, Visualization, And Self-Service Analysis
This is usually the first thing buyers see, and for good reason. If people cannot use the platform easily, adoption stalls.
Look for:
- Interactive dashboards with filters and drill-downs
- Clear visualizations for KPIs, trends, and comparisons
- Self-service analysis for non-technical users
- Role-based views for executives, managers, and departments
- Customizable layouts that match business priorities
IntelliFront BI is relevant here because it is built around KPI dashboards and business visibility. For organizations that want a centralized way to review operational and executive metrics, that focus matters. The knowledgebase articles for IntelliFront BI can help teams understand how the platform supports dashboard creation and user access.
A strong self-service layer also lowers the reporting burden on IT. Users should be able to answer common questions on their own without opening a ticket every time they need a filtered view.
For a useful outside comparison of dashboard best practices, Tableau's articles on data visualization are worth reading.
Data Integration, Governance, And Security Controls
A dashboard is only as useful as the data behind it.
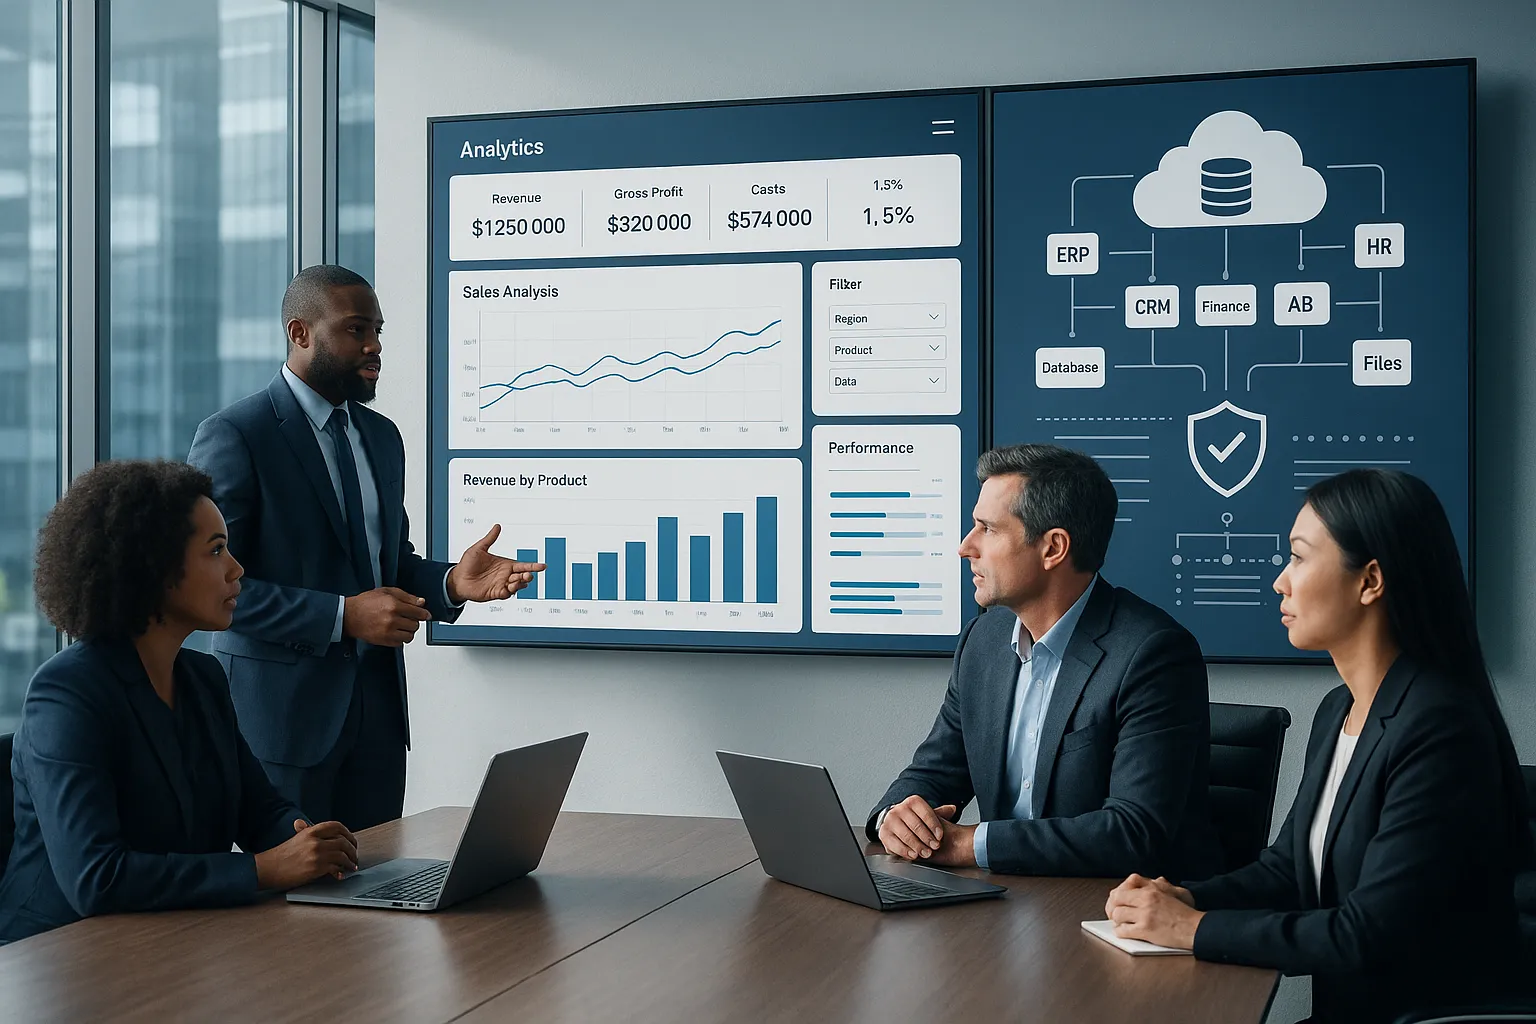
That means data analytics software for businesses must connect to the systems the business already uses: ERP, CRM, HR, finance platforms, cloud databases, spreadsheets, and line-of-business apps. If integration is weak, the tool becomes another silo.
We should also evaluate governance early, not later. Governance sounds boring until two executives bring different KPI values into the same meeting.
Key requirements include:
- Broad data connectors for cloud and on-premises sources
- Data modeling support for consistent metric definitions
- User permissions by role, team, or function
- Auditability for regulated industries
- Security controls that align with enterprise policy
For healthcare, financial services, and other regulated environments, these controls are not optional. They affect compliance, trust, and rollout speed.
Automated Scheduling, Distribution, And Report Delivery
For most enterprise software evaluations, this would be a major category. It matters because stakeholders need timely access to updated information.
That said, when we focus specifically on IntelliFront BI, we should be clear: its relevance in this text is around business intelligence, dashboarding, and KPI analysis, not report automation, scheduling, or delivery - though it does have this capability.
So in this section, the practical takeaway is simple. If your organization needs one platform for analytics and another for large-scale reporting operations, define those roles clearly before you buy. Don't assume every analytics tool is designed to serve every reporting process equally well.
This is one reason buyers should separate these questions:
- Do we need interactive analysis?
- Do we need executive KPI dashboards?
- Do we need operational reporting at scale?
- Do we need strict governance and security?
The best data analytics software for businesses matches the use case instead of promising to do everything at once.
Types Of Data Analytics Software And Who They Fit Best

The category is broad. A platform that works well for a digital product team may not fit a global finance organization.
Here are the main types to know.
Business Intelligence Platforms
This is the category most people mean when they talk about data analytics software for businesses.
Business intelligence platforms combine dashboards, data models, visual analysis, and KPI tracking. They help leaders and teams monitor performance across departments.
Common examples include Microsoft Power BI, Tableau, Qlik Sense, and Looker. Each has its own strengths:
- Power BI often fits Microsoft-heavy environments
- Tableau is known for flexible visual exploration
- Qlik Sense is strong for associative analysis
- Looker fits warehouse-centric analytics strategies
IntelliFront BI belongs in this conversation as a BI and dashboard platform for organizations that want accessible KPI reporting and centralized visibility. If your business needs executive dashboards, departmental analytics, and a cleaner way to review performance across teams, it is directly relevant. The IntelliFront BI product page gives a practical overview of how ChristianSteven positions it.
Embedded Analytics And Operational Reporting Tools
These tools serve a different job. They place analytics inside another application or support operational users who need reporting within day-to-day workflows.
A SaaS company, for example, may want customers to see usage metrics inside the product. A field service operation may need supervisors to review service data from within an internal app.
In these cases, the priority is not just dashboard quality. It is context. The analytics must appear where people already work.
Sisense is often discussed in this category. You can also see good examples in product analytics platforms and application-focused BI layers.
Enterprise Reporting Automation Solutions
This group is often confused with analytics software, but it is not exactly the same.
These tools help organizations standardize data preparation, reporting workflows, and high-volume business reporting processes. Some focus on transforming data. Others focus on operational reporting at scale.
Examples often discussed in the market include Alteryx for data prep and dbt for transformation logic. Their value is real, but they are not substitutes for every BI need.
That distinction matters. If the business goal is interactive KPI visibility, choose a BI platform. If the goal is data transformation and reporting operations, your shortlist may look different.
This is why data analytics software for businesses should always be chosen by use case, not by hype.
How To Evaluate Data Analytics Software For Your Organization
A polished demo can hide a poor fit. We've seen buyers get excited by visuals, then struggle with deployment, governance, or adoption a few months later.
A better approach is to evaluate software with a short list of business questions.
Questions To Ask About Scalability, Deployment, And Administration
Start with the operating reality of your organization.
Ask:
- Can it support our data volume and user count?
- Does it fit our cloud, on-premises, or hybrid requirements?
- How hard is it to administer permissions and user access?
- Can different business units share trusted KPI definitions?
- Will it work with our current data stack and security policies?
For enterprise teams, administration matters more than many vendors admit. A tool may look friendly in a proof of concept but become difficult once hundreds of users, multiple business units, and audit requirements enter the picture.
When reviewing data analytics software for businesses, we should also check whether the platform supports broad stakeholder access without making every change dependent on a technical specialist.
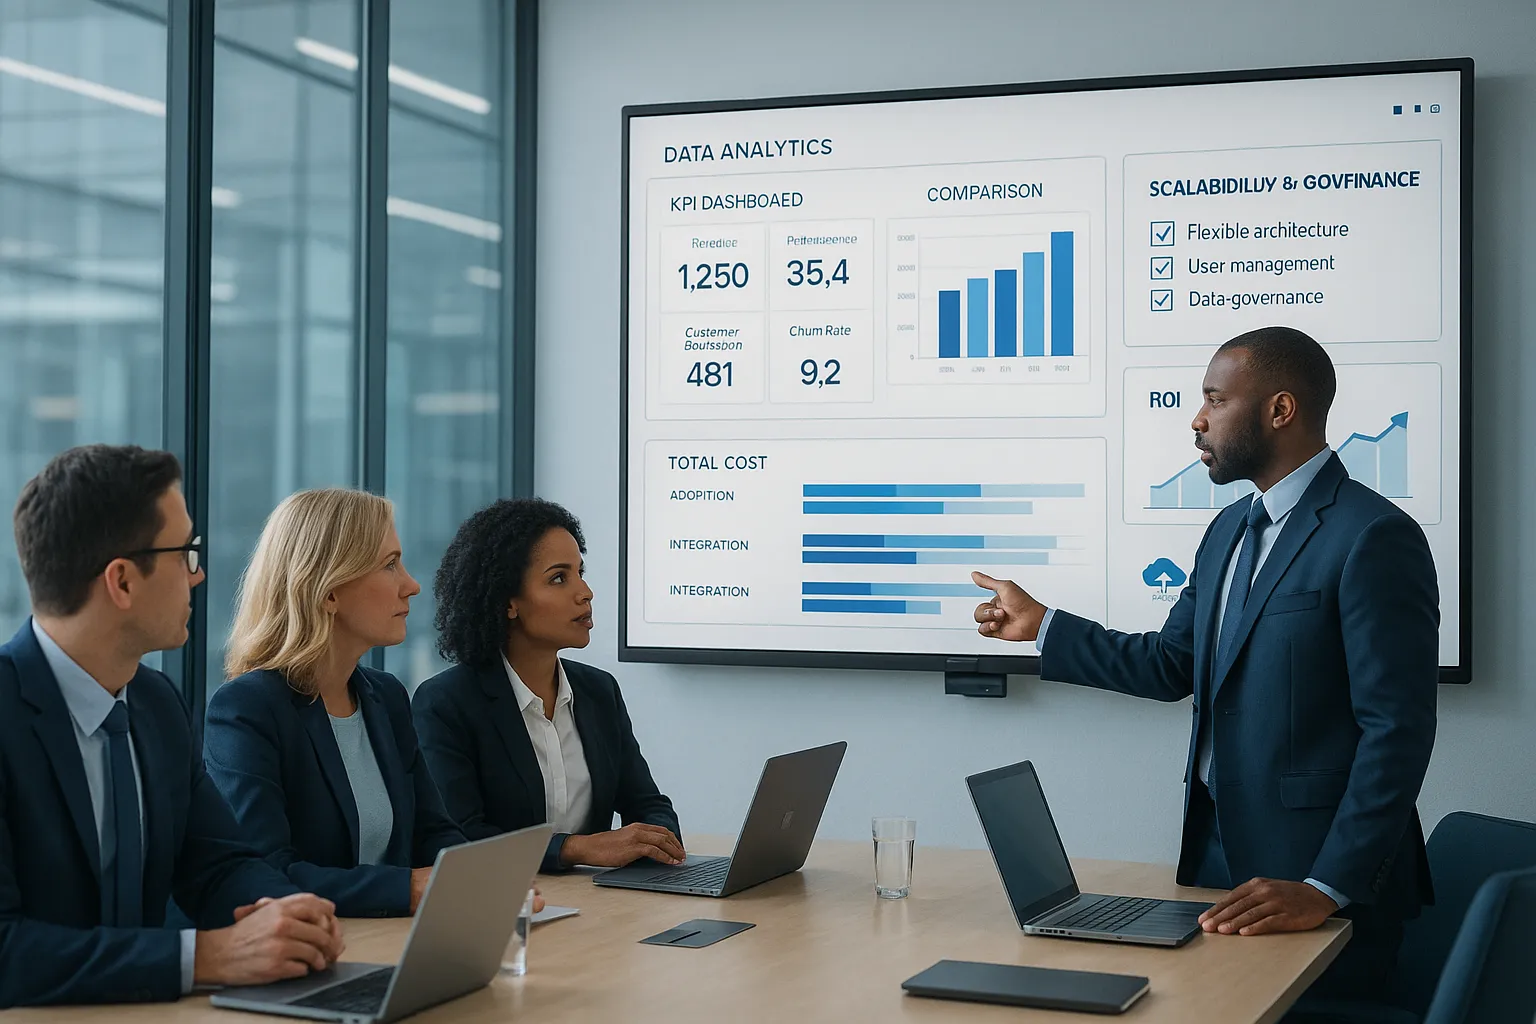
How To Compare Total Cost, Adoption, And ROI
Price is not just license cost.
We need to look at implementation effort, training needs, admin overhead, data prep burden, and the cost of low adoption. A cheaper platform that only a few analysts use can cost more in practice than a well-adopted one with a higher subscription fee.
A simple comparison framework helps:
| Criteria | What to assess |
|---|---|
| Total cost | Licensing, setup, maintenance, support, internal staffing |
| Adoption | Ease of use, learning curve, executive usability, self-service access |
| Time to value | How quickly teams can build dashboards and trust the data |
| ROI | Faster decisions, reduced manual effort, better KPI visibility |
| Fit | Alignment with industry, governance, deployment, and reporting needs |
For IntelliFront BI, the business case is strongest when teams need centralized KPI dashboards and accessible business intelligence views across functions. That can support use cases such as:
- Executive scorecards for revenue, margin, and strategic targets
- Operations dashboards for production output, service levels, or backlog
- Sales performance tracking by rep, region, or product line
- Finance visibility into budget versus actuals and exception trends
- Healthcare or regulated reporting views where governance and access control matter
And if you're comparing vendor categories, Gartner's general guidance on analytics and BI platforms can also help frame evaluation criteria, though access may depend on subscription.
Common Mistakes Businesses Make When Choosing Analytics Software
The biggest mistake is buying for the demo instead of the business problem.
A dashboard may look impressive in a sales call. But if the platform does not fit your data sources, governance model, or user base, the excitement fades quickly.
Other common mistakes include:
- Ignoring integration requirements and creating new silos
- Choosing advanced features over usability and hurting adoption
- Skipping governance planning until KPI conflicts appear
- Underestimating administration needs across teams and roles
- Assuming every analytics tool handles every reporting need equally well
We also see companies overlook the difference between analysis and reporting operations. They buy one platform expecting it to solve every visibility problem in the business. Usually, that creates friction.
The better move is to define the primary goal first. If you need data analytics software for businesses that improves KPI visibility and cross-functional insight, prioritize BI capabilities, integration, and governance. If your needs are different, your shortlist should be different too.
And yes, adoption should be treated as a hard requirement. If business users avoid the tool, the implementation is not a success, no matter how strong the feature sheet looks.
Conclusion
Choosing data analytics software for businesses comes down to fit.
We need a platform that matches our data environment, supports clear KPI reporting, gives users confidence in the numbers, and helps teams act faster. That usually means looking past flashy visuals and focusing on integration, governance, usability, and business value.
For organizations that want dashboard-driven business intelligence and KPI visibility, IntelliFront BI from ChristianSteven deserves a look. The IntelliFront BI product page explains the platform's role, and the IntelliFront BI knowledgebase provides practical reference content for deeper review.
The right platform does more than display data. It helps the business see what matters, sooner, and respond with confidence.
Key Takeaways
- Data analytics software for businesses transforms scattered data into actionable insights, improving decision-making and aligning KPI definitions across teams.
- Interactive dashboards with filters and role-based views empower users to explore performance independently, reducing IT and analyst bottlenecks.
- Integration with existing systems and strong governance controls are essential to ensure data consistency, security, and compliance in analytics platforms.
- Choosing the right data analytics software depends on your specific use case—prioritize business intelligence platforms for KPI visibility and dashboards.
- Evaluate analytics tools based on scalability, ease of use, total cost of ownership, and adoption potential, not just visual appeal or feature hype.
- Avoid common mistakes like neglecting integration, governance, and user adoption, focusing instead on solutions that fit your organization's data environment and reporting needs.
Frequently Asked Questions About Data Analytics Software for Businesses
What is the role of data analytics software for businesses?
Data analytics software helps businesses collect, organize, analyze, and present data, enabling teams to share insights via interactive dashboards and make faster, more accurate decisions across departments.
How does data analytics software support faster decision-making?
It provides near-real-time business intelligence with interactive dashboards, drill-downs, and natural language querying, allowing users to track KPIs and explore trends without delays, reducing reliance on IT teams.
Why is manual reporting no longer sufficient for growing businesses?
Manual reporting cannot scale due to increased data volume and complexity, leading to errors and delays. Automated analytics software ensures consistent metrics, timely updates, and frees teams to focus on analysis instead of data preparation.
What core features should businesses look for in analytics software?
Key features include interactive dashboarding, self-service analysis, broad data integration, strong data governance, role-based security, and automated report scheduling to ensure accuracy, usability, and compliance.
How do different types of data analytics software fit various business needs?
Business intelligence platforms like Power BI suit performance monitoring; embedded analytics tools like Sisense integrate insights into applications; and reporting automation solutions like Alteryx focus on data preparation and operational reporting.
What common mistakes should businesses avoid when selecting analytics software?
Common errors include choosing tools based on demos rather than needs, neglecting integration, overlooking usability and governance, and assuming one platform fits all reporting and analysis requirements.

No Comments Yet
Let us know what you think