Share this
by Bobbie Ann Grant on Apr 14, 2026 5:45:01 AM
In most enterprises, our problem isn't a lack of data, it's the constant chase to get the right information to the right people at the right time.
Tableau subscriptions and alerts were designed to solve exactly that. Instead of executives and managers logging into dashboards every morning, we can push tailored snapshots to their inboxes and trigger targeted alerts only when something important changes.
In this text, we'll walk through how Tableau subscriptions and data‑driven alerts work, when to use each, how to design dashboards that are actually "subscription‑ready," and how to manage this at scale across an enterprise. We'll also look at how ATRS software from ChristianSteven extends Tableau's native capabilities for organizations that need industrial‑strength automation and scheduling.
How Tableau Subscriptions And Alerts Work

Key Components Of Tableau Subscriptions
Tableau subscriptions let us send scheduled snapshots of a view or workbook to users via email. Think of them as automated "morning briefing" emails built directly from our dashboards.
Key elements:
- Schedule – We choose how often to send: daily, weekly, at specific times, or aligned to data refreshes.
- Content format – Recipients usually get an image or PDF of the view, often with a link back to the live dashboard.
- Filters and personalization – Subscriptions respect view filters, row‑level security, and user context. We can set up subscriptions that deliver different slices of the same dashboard to different regional managers or sales reps.
- Conditional send – Options such as "don't send if view is empty" help us avoid sending irrelevant reports when there's no data.
From a stakeholder's perspective, this replaces the manual routine of opening Tableau Server, navigating to a workbook, setting filters, and exporting. Instead, the right slice of data simply shows up in their inbox.
For example, a global sales organization might subscribe each regional VP to a weekly sales performance view, filtered to their territory. They never need to touch Tableau itself, the subscription handles the repeatable work.
How Data‑Driven Alerts Keep Stakeholders Informed
Data‑driven alerts are different. Instead of sending snapshots on a fixed schedule, they fire only when a measure crosses a threshold.
We typically:
- Open a view with a continuous axis (e.g., daily revenue, open tickets, error rate).
- Right‑click the axis and create an alert.
- Choose a condition such as "is above," "is below," or "is equal to," plus a numeric threshold.
- Set frequency (up to hourly) and recipients.
When Tableau Server or Cloud evaluates the alert and finds the condition is met, it sends notifications, usually via email, sometimes through integrations like Slack.
This is ideal for operational monitoring: we don't want executives watching a dashboard all day to see if abandonment rate spikes or order volume collapses. We'd rather they only hear from us when something actually crosses a predefined line.
In practice, many enterprises combine both:
- Subscriptions for predictable, routine visibility.
- Alerts for exceptions and incidents that can't wait for the next scheduled report.
When To Use Subscriptions Versus Alerts
Use Cases For Tableau Subscriptions In Enterprise Reporting
Subscriptions shine wherever we have recurring information needs and a stable audience. Common examples we see in enterprise environments include:
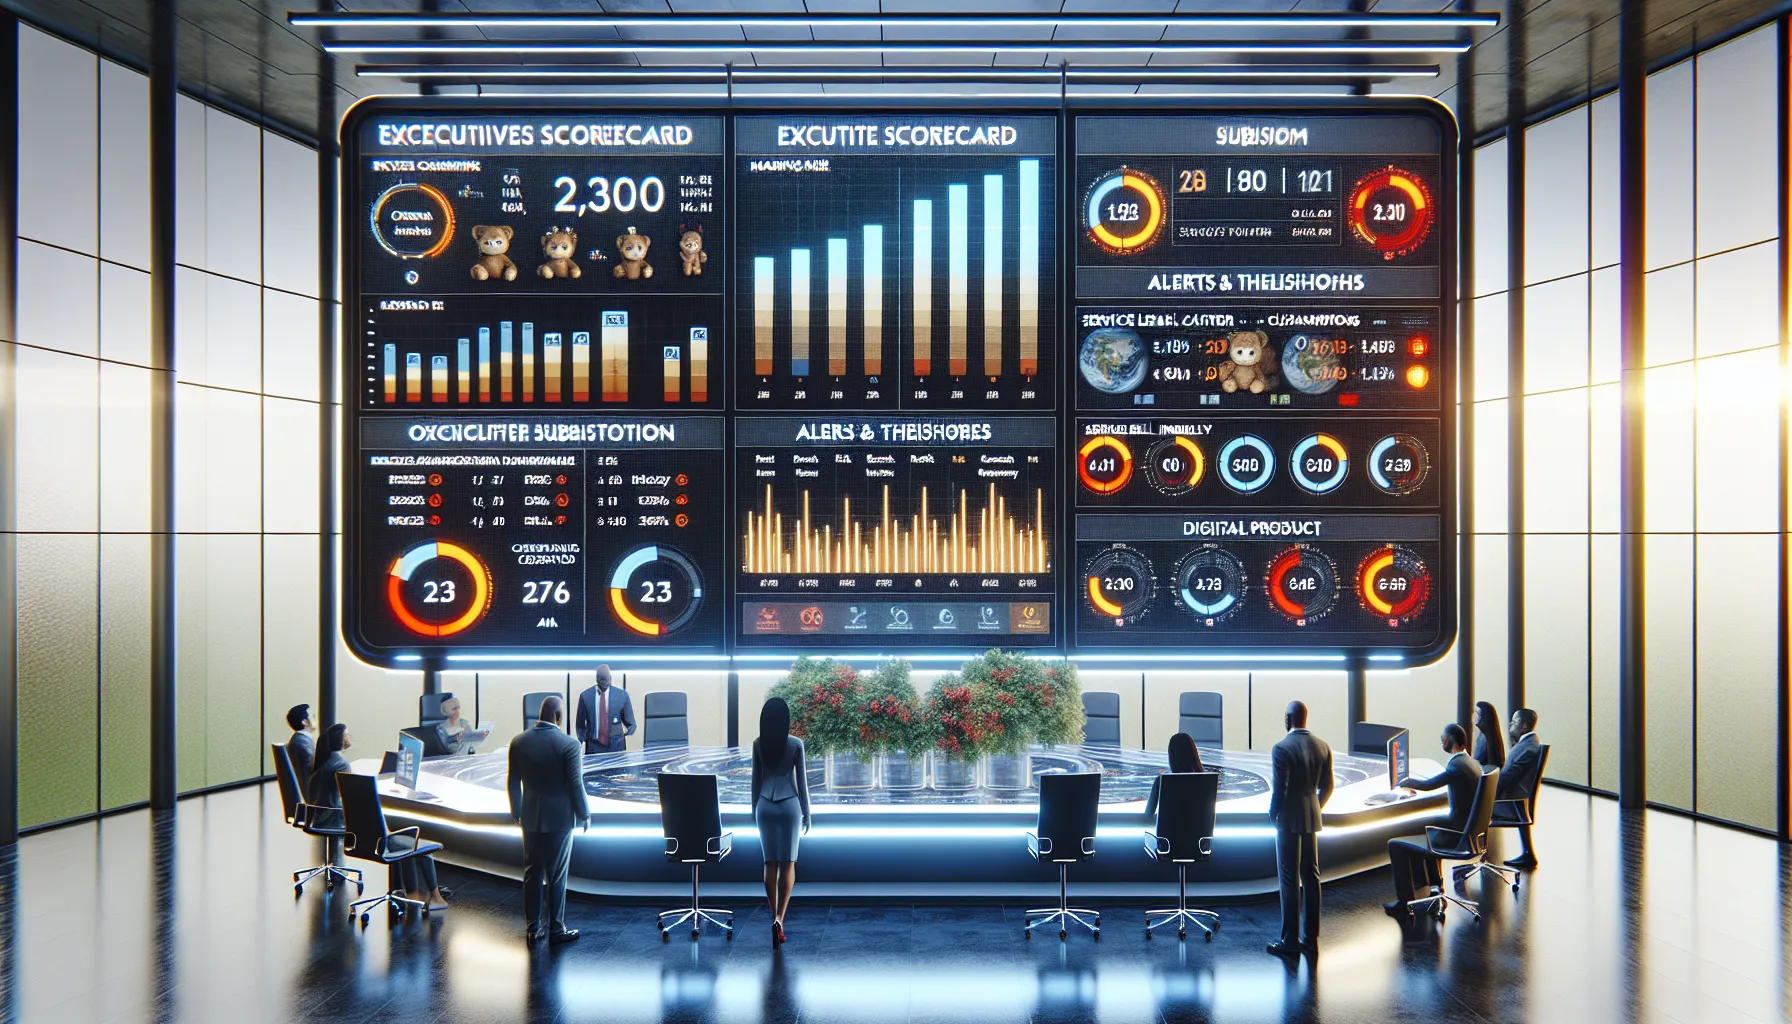
- Executive scorecards – Weekly or monthly KPIs for C‑level leaders: revenue, margin, pipeline, churn, customer satisfaction. Subscriptions ensure those numbers arrive on a predictable cadence.
- Sales territory and quota reporting – Each rep receives a filtered view showing their quota attainment, pipeline health, and key accounts. Filters (and functions like
USERNAME()) let us personalize the same dashboard for hundreds of users. - Finance and compliance packs – End‑of‑month P&L views, variance analyses, and regulatory reporting can be bundled as subscriptions rather than a manual export marathon.
- Operations reviews – Daily or shift‑based production, call center metrics, or logistics dashboards delivered to supervisors and plant managers.
In all of these, the value is consistency. Stakeholders know that at 8:00 a.m. they'll see an up‑to‑date snapshot of what matters to them.
Use Cases For Data‑Driven Alerts In Operational Monitoring
Alerts work best when time sensitivity and thresholds are the main concern. Typical enterprise uses include:
- Service‑level and incident thresholds – Trigger an alert when ticket backlog exceeds a set level, first response time breaches SLA, or error rates climb above normal.
- Risk and compliance events – Notify risk teams if a limit is approached or exceeded (e.g., credit exposure, fraud risk indicators, suspicious transaction volume).
- Supply chain and inventory – Alert planners when stock dips below safety levels or order cycle times exceed acceptable bounds.
- Digital product performance – Notify product owners if signups drop more than a certain percentage day‑over‑day or if conversion rates crash after a release.
We usually pair alerts with clearly defined playbooks so that when an alert fires, teams know exactly what to check and how to respond. That's where they move from "nice to have" to genuinely operationally critical.
Designing Subscription‑Ready Dashboards And Views

Structuring Dashboards For Email Consumption
Not every Tableau dashboard works well as an email snapshot. A view that's perfect on a 24‑inch monitor can be unreadable in an inbox.
When we design for subscriptions, we:
- Prioritize a single key question per view – "Are we on track for the month?" or "Is call volume within normal range?" The top of the view should answer that at a glance.
- Use simple, vertical layouts – Multiple small charts stacked vertically tend to render better in email than complex, side‑by‑side layouts that shrink illegibly.
- Leverage visual cues – Color, icons, and simple KPI tiles quickly communicate status without requiring interaction.
- Include clear drill‑through links – A clickable title or button that opens the full interactive dashboard in Tableau helps people move from summary to detail.
We also think about the audience's behavior. Executives often skim on mobile: operational managers may open on desktop during a stand‑up meeting. Subscriptions should work gracefully for both.
Performance, Filters, And Permissions Considerations
Behind the scenes, successful subscriptions and alerts depend on solid performance and security design.
Key considerations:
- Data refresh and latency – If subscriptions run before extracts refresh, we send yesterday's data. We align schedules so email delivery follows data refresh windows.
- Filter design – Overly complex or nested filters can slow down subscription runs, especially for large audiences. We standardize key filters (region, product line, time) and avoid unnecessary complexity.
- Row‑level security (RLS) – Proper RLS is critical when one workbook feeds many users. Subscriptions must respect user entitlements so no one sees data they shouldn't.
- Permissions – Users need View (and often Download) permissions on the workbook. Broken permissions are a very common cause of "I didn't get my subscription" complaints.
- SMTP and email configuration – Misconfigured SMTP settings or spam filtering can silently kill adoption. We usually coordinate with IT to whitelist sending domains and test across major clients.
These same principles apply if we also distribute reports from other BI platforms. For example, Microsoft's official Power BI documentation emphasizes similar alignment between data refresh, security roles, and scheduled delivery, reinforcing that automation only works if the plumbing is sound.
Configuring And Managing Tableau Subscriptions At Scale

Scheduling, Frequency, And Delivery Options
At small scale, individual users can subscribe themselves. At enterprise scale, we need a more deliberate scheduling strategy.
We usually:
- Standardize time windows – For example, run most subscriptions in waves (6:30, 7:00, 7:30 a.m.) to avoid hammering the server continuously.
- Align with business rhythms – Daily operational snapshots, weekly management packs, monthly and quarterly executive briefings.
- Balance frequency and load – Hourly subscriptions across thousands of users can quickly overwhelm infrastructure. We reserve high‑frequency schedules for truly critical views.
- Segment recipients by role – Instead of one huge "all employees" subscription, we target by department, region, or seniority to keep content relevant and manageable.
For many organizations, native Tableau scheduling is enough. But when we need more sophisticated orchestration, chaining jobs, integrating with external triggers, or coordinating complex distribution lists, we often bring in specialized scheduling tools.
This is where ATRS software from ChristianSteven becomes highly relevant. ATRS is a dedicated automation and report scheduling solution that can act as a Tableau report scheduler for enterprises that outgrow the built‑in options. We can, for example:
- Trigger Tableau report delivery based on upstream ETL completion rather than just fixed times.
- Orchestrate complex sequences (run job A, then send dashboard B to one group and C to another, only if validations pass).
- Centrally manage distribution rules and formats across very large recipient lists.
In heavily regulated or globally distributed organizations, this extra layer of control can make the difference between "subscriptions are helpful" and "subscriptions are now a mission‑critical system."
Admin Controls, Governance, And User Management
On Tableau Server or Cloud, admins and project leaders have a significant role in subscription governance:
- Central schedule management – Defining which schedules exist, their frequency, and who can use them.
- Quota and limit policies – Controlling how many subscriptions a user or project can create to prevent abuse and performance degradation.
- Access auditing – Reviewing who's subscribed to what, and whether those subscriptions still make sense as roles change.
- Deprovisioning – Ensuring that when employees leave or change roles, their subscriptions are removed or reassigned.
We treat subscriptions and alerts as part of our broader BI governance framework, just like data sources and workbooks. Clear ownership (who owns this subscription? who maintains the dashboard?) avoids the "orphaned email report" problem that silently spreads outdated metrics.
Best Practices For Data‑Driven Alerts

Choosing The Right Thresholds And Conditions
An alert is only as useful as the threshold behind it. If we set the bar too low, the team gets flooded with noise: too high, and we miss real issues.
Good practice includes:
- Using historical data to set baselines – Before defining "too high" or "too low," we analyze historical distributions and natural variance.
- Focusing on actionable conditions – We only create alerts where we know what action should follow. "Revenue below 90% of plan" might kick off a review of pipeline and marketing spend.
- Avoiding overlapping alerts – Multiple alerts on similar metrics (e.g., daily revenue and weekly revenue with the same threshold logic) can be consolidated.
- Including directionality – "Drops by more than 20% compared to previous period" is more meaningful than a static absolute threshold for many growth metrics.
We also favor starting conservative, monitoring alert volume, and tightening thresholds as teams become comfortable responding.
Avoiding Alert Fatigue And False Positives
Alert fatigue is real. If our stakeholders get 20 alert emails a day, most of them will be ignored.
To reduce noise:
- Cap alert frequency – Hourly is usually the maximum: often daily is enough. If the underlying data updates less often, there's no reason to check more frequently.
- Bundle related conditions – Instead of four separate alerts on related metrics, consider one composite metric or a single dashboard that highlights multiple issues.
- Delay after data refresh – If our pipelines occasionally deliver partial data, we may want alerts to run slightly after refresh to reduce false positives.
- Review alerts regularly – KPIs change, thresholds become obsolete. We schedule periodic reviews of active alerts to prune those that no longer add value.
We encourage teams to treat alerts almost like a product: define the audience, the problem, the expected action, and then tune based on feedback.
Integrating Tableau Subscriptions And Alerts Into Enterprise Workflows
Coordinating With Other Reporting And BI Tools
Most enterprises don't live in a Tableau‑only world. We often operate a mix of Tableau, Power BI, legacy reporting tools, and even spreadsheets.
To avoid fragmentation, we:
- Define a clear "system of reference" per domain – For example, Tableau for customer analytics, Power BI for finance and operational dashboards, and so on.
- Align cadence across platforms – If sales leadership receives a Tableau subscription while finance gets a comparable Power BI report, we try to synchronize timing so conversations happen around the same data window.
- Standardize alerting practices – Naming conventions, recipient groups, and severity levels should look similar whether an alert originates in Tableau or another platform.
Community resources such as the Power BI community forums show how other organizations grapple with multi‑tool environments: we apply similar integration thinking on the Tableau side to keep the overall BI experience coherent.
ATRS software from ChristianSteven can play a coordinating role here as well. Because it's built specifically for cross‑platform report scheduling and automation, we can use ATRS to orchestrate when Tableau dashboards are distributed relative to reports from other systems, ensuring stakeholders get a unified reporting experience instead of a noisy stream of uncoordinated emails.
Aligning With Incident Management And Business Processes
Alerts are only useful if they tie into real processes.
We integrate Tableau alerts with:
- ITSM and incident systems – For critical infrastructure or application metrics, an alert might create or enrich tickets in tools like ServiceNow or Jira.
- Runbooks and playbooks – Each alert type should map to a documented response procedure so teams don't have to improvise every time something fires.
- Business review cycles – Subscriptions that feed weekly performance meetings are designed with those agendas in mind: each chart on the email has a place in the discussion.
ATRS adds another layer of process alignment by letting us embed Tableau‑based reporting into broader business workflows, for example, kicking off a distribution step only after a nightly reconciliation job succeeds, or routing a compliance‑sensitive report to specific approvers before it's emailed to regulators or partners.
Common Challenges And How To Troubleshoot Them
Delivery Failures, Performance Issues, And Security Gaps
When Tableau subscriptions and alerts don't behave, it's usually one of a few root causes:
- Email delivery problems – Misconfigured SMTP, changed passwords, or spam filtering. We check Tableau logs, confirm SMTP settings, and coordinate with email admins to whitelist senders.
- Permission and licensing issues – If a user loses access to a workbook or their site role changes, subscriptions can silently fail. Regular audits of permissions and license status help.
- Server load and performance bottlenecks – Too many concurrent subscriptions, poorly optimized workbooks, or heavy extracts can cause timeouts. We may need to stagger schedules, optimize data sources, or scale infrastructure.
- Security misconfigurations – Weak row‑level security or overly broad permissions can expose sensitive data via subscriptions. We treat RLS as non‑negotiable for any report that includes confidential information.
For organizations that use ATRS software from ChristianSteven, some of these issues can be mitigated or surfaced more clearly. ATRS offers richer logging and centralized control over scheduling, which helps us see patterns (like consistently failing jobs) earlier and adjust before stakeholders lose trust.
Scaling From Departmental To Enterprise‑Wide Automation
Scaling is less about technology and more about discipline.
As we expand from a single team's subscriptions to enterprise‑wide automation, we:
- Establish a reporting catalog – Document which subscriptions and alerts exist, who owns them, and which KPIs they support.
- Create templates and standards – Consistent email layout, naming conventions, and visual design help users quickly interpret what they receive.
- Pilot, then roll out – We test new high‑impact subscriptions with a small audience, refine the design, then expand.
- Use tiered support – Local analytics leads handle first‑line support: central BI teams manage platform‑level issues and governance.
ATRS can support this scaling by acting as the central nervous system for scheduling and report distribution across multiple Tableau sites or environments. Instead of each department managing its own siloed schedules, we gain a single orchestration layer that enforces standards and makes enterprise automation both safer and easier to maintain.
Conclusion
When we design and govern them thoughtfully, Tableau subscriptions and alerts become much more than convenience features, they evolve into a dependable nervous system for the enterprise.
Subscriptions give our leaders and frontline teams a steady drumbeat of information: alerts make sure we don't miss the rare but critical exceptions. With solid dashboard design, careful threshold choice, strong governance, and the right supporting tools like ATRS software from ChristianSteven, we can automate insight delivery at scale while keeping performance, security, and relevance firmly under control.
The result is a reporting ecosystem where people don't chase data. Instead, the right data finds them, exactly when they need it.
Key Takeaways
- Tableau subscriptions and alerts help deliver the right data to the right people by sending scheduled snapshots for routine reporting and triggering notifications only when key metrics cross defined thresholds.
- Use Tableau subscriptions for predictable, recurring needs—like executive scorecards, sales territory reports, and operational summaries—designed in simple, email-friendly layouts with clear drill-through links.
- Use data-driven alerts for time-sensitive, exception-based monitoring by setting meaningful thresholds, basing them on historical baselines, and pairing each alert with a clear response playbook to avoid noise and alert fatigue.
- Effective Tableau subscriptions and alerts depend on aligned data refresh schedules, optimized filters, robust row-level security, and well-governed permissions, all managed within a broader BI governance framework.
- At enterprise scale, organizations improve reliability and orchestration of Tableau subscriptions and alerts by standardizing schedules, cataloging reports, and using tools like ATRS from ChristianSteven to coordinate complex, cross-platform scheduling workflows.
Frequently Asked Questions About Tableau Subscriptions and Alerts
What are Tableau subscriptions and alerts, and how do they differ?
Tableau subscriptions send scheduled snapshots of dashboards or views to users via email, like automated briefing reports. Data-driven alerts only fire when a metric crosses a defined threshold. Subscriptions support routine, predictable reporting, while alerts are designed for time‑sensitive exceptions and incidents that require immediate attention.
When should I use Tableau subscriptions versus data‑driven alerts in an enterprise?
Use subscriptions for recurring needs like executive scorecards, sales territory reports, or daily operational summaries where cadence and consistency matter. Use alerts when thresholds and urgency are key, such as SLA breaches, risk events, inventory shortages, or sudden drops in digital product performance that can’t wait for the next scheduled email.
How do I design dashboards that are subscription‑ready for email consumption?
Focus each view on a single core question, use a simple vertical layout, and emphasize clear KPIs, colors, and visual cues that read well on smaller screens. Include prominent links or buttons to open the full interactive dashboard in Tableau, and test snapshots on both desktop and mobile email clients.
What are best practices for setting thresholds in Tableau data‑driven alerts?
Base thresholds on historical data and natural variance, and only create alerts when there is a clear, defined action to take. Avoid overlapping or redundant alerts, incorporate directionality (e.g., drops vs. increases), start with conservative settings, then refine thresholds and frequency based on alert volume and team feedback.
How can ATRS software from ChristianSteven enhance Tableau subscriptions and alerts?
ATRS acts as an advanced Tableau report scheduler for organizations needing more control than native options. It can trigger Tableau report delivery based on ETL completion, orchestrate complex job sequences, manage large distribution lists centrally, and coordinate Tableau subscriptions and alerts with reports from other BI platforms in multi‑tool environments.
Can Tableau subscriptions and alerts integrate with tools like Slack, ServiceNow, or Jira?
Yes. Tableau data‑driven alerts can send email notifications that many teams route into Slack channels via email integrations. For deeper workflow integration, alerts and subscription outputs can feed ITSM tools like ServiceNow or Jira via connectors, webhooks, or orchestration platforms, tying Tableau events directly into incident and task management processes.

No Comments Yet
Let us know what you think