Share this
by Bobbie Ann Grant on Apr 22, 2026 12:45:01 AM
Centralized reporting portal projects usually start with a simple goal: give people one place to find the right data without chasing links, files, or outdated dashboards. In large organizations, that sounds obvious. In practice, it's hard.
Reports live in too many places. Access rules differ by team. Executives want summaries, analysts need detail, and operations teams need quick answers they can trust. When BI content is spread across email threads, shared drives, and disconnected apps, people waste time before they even start analyzing anything.
That's where a centralized reporting portal helps. It brings dashboards, reports, KPIs, and supporting data into one governed environment. And when that portal is designed well, it improves both access and decision-making.
For organizations evaluating options, IntelliFront BI from ChristianSteven is relevant here because it gives teams a web-based hub for BI dashboards, KPI views, and reporting access in a controlled, business-friendly interface. We'll show where a centralized reporting portal fits, what features matter, and how enterprise teams can carry out one without creating another layer of confusion.
What A Centralized Reporting Portal Is And Why It Matters
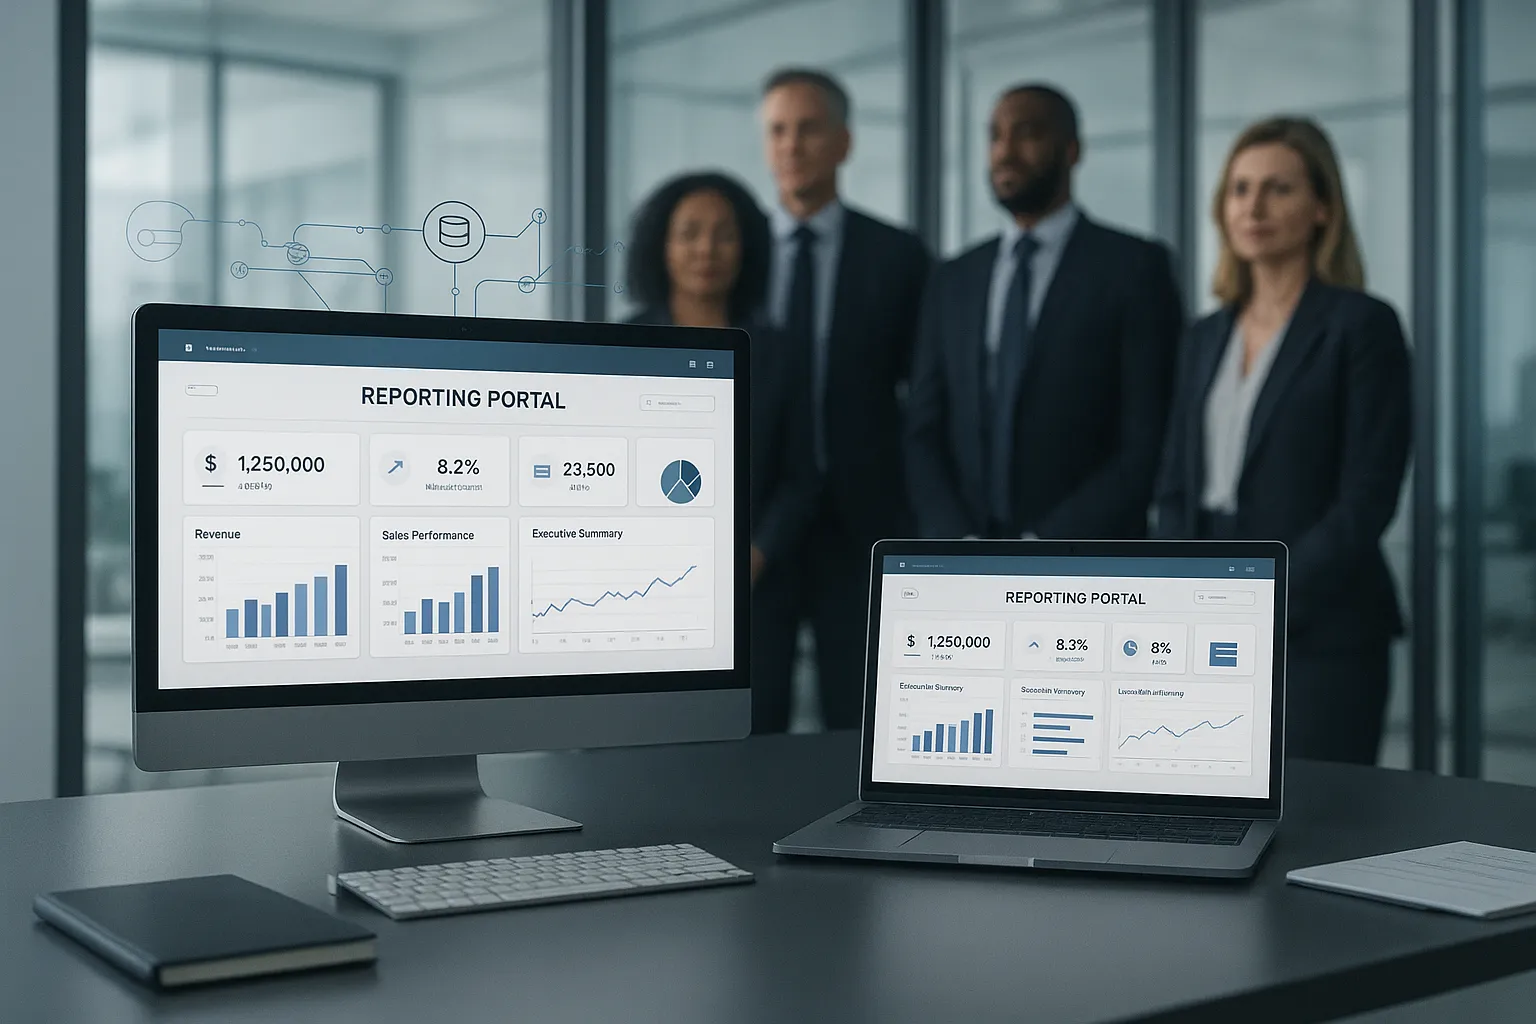
A centralized reporting portal is a single digital location where people can access approved reports, dashboards, and business metrics from multiple systems. Instead of asking, "Which version is correct?" users go to one place, use one login experience, and work from governed information.
At its core, the portal solves a trust problem. If finance uses one dashboard, sales uses another, and operations keeps exports in spreadsheets, the business ends up with conflicting numbers. A centralized reporting portal reduces that risk by creating a common access layer for BI content.
Why does it matter so much in enterprise settings?
- It reduces data silos across departments
- It improves consistency in how reports are presented
- It supports security with controlled access by role
- It shortens time to insight because users know where to go
- It strengthens confidence in KPIs and executive reporting
This is especially useful when teams rely on many data sources. APIs, database connections, and integrated data pipelines can feed a portal so users see current information without jumping between systems.
In practical terms, a centralized reporting portal becomes the front door to business intelligence. Users don't need to know where the source data lives. They need fast access to the right metric, chart, or drill-down view.
That's one reason IntelliFront BI fits this topic well. ChristianSteven positions it as a business intelligence and KPI dashboard solution built to centralize data analytics and reporting access. Its product page highlights a browser-based experience for dashboards and visual analysis, while the IntelliFront BI knowledgebase provides implementation and usage guidance for teams that need a governed BI environment.
If you want a broader outside perspective, IBM's overview of business intelligence reinforces the point: decision quality improves when users can access trusted, shared insight from a consistent system.
Common Reporting Challenges It Solves For Enterprise Teams
Enterprise reporting rarely fails because of a lack of data. It fails because the data experience is fragmented.
A centralized reporting portal addresses several common problems at once.
First, it fixes scattered report access. Teams often pull reports from inboxes, file shares, BI tools, and saved exports. That creates version confusion fast. One person reviews yesterday's file while another opens a live dashboard, and both think they're right.
Second, it improves report consistency. When different departments build their own layouts and naming conventions, readers spend too much time interpreting structure instead of understanding results. A centralized reporting portal standardizes how reports look, how KPIs are labeled, and how users move from summary to detail.
Third, it supports quality control. In decentralized environments, reports can be copied, modified, and redistributed without governance. That opens the door to manual edits, broken formulas, or context-free screenshots.
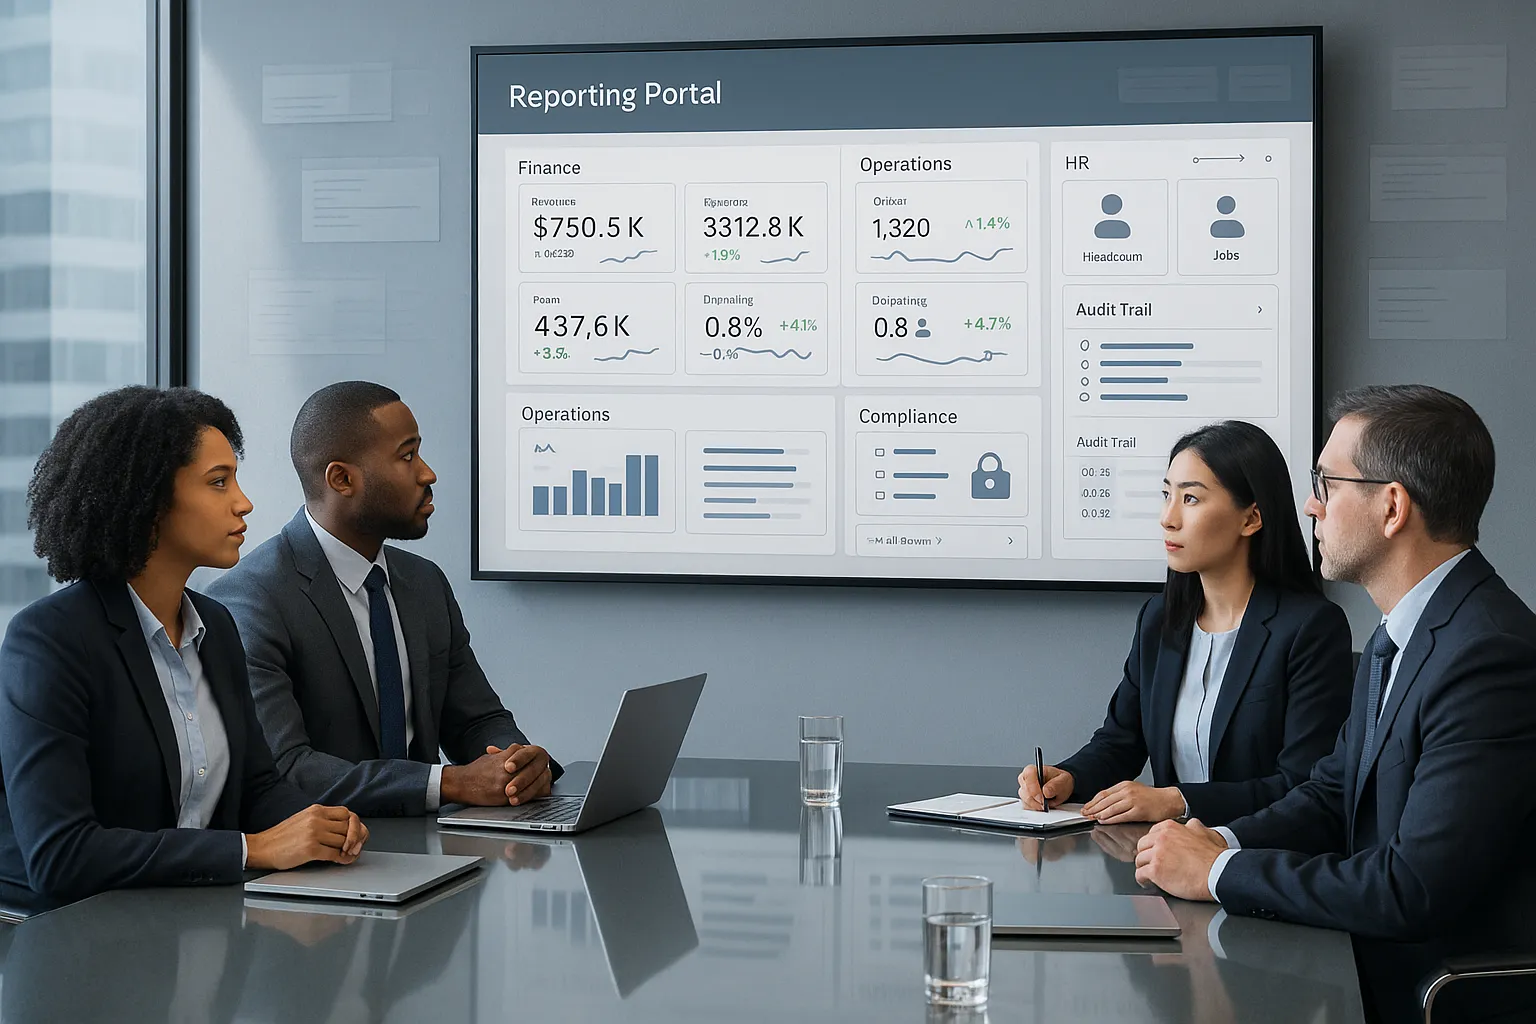
Fourth, it helps with compliance and accountability. Many enterprises need audit trails, permission controls, and documented ownership. A portal makes it easier to show who can see what, which reports are approved, and where official information lives.
Here are a few business use cases where that matters:
- Finance: Create one trusted location for revenue, margin, and budget variance dashboards
- Operations: Give plant or regional leaders access to service levels, incidents, and throughput trends
- HR: Centralize workforce metrics while limiting sensitive details by role
- Compliance: Surface audit findings, control exceptions, and risk summaries in one governed view
- Executive leadership: Provide a high-level KPI portal with drill-down paths into department detail
A centralized reporting portal also helps when source systems change. If teams depend on direct exports from many systems, even a minor system update can break workflows or mislead users. Centralizing access reduces that exposure because users rely on the portal's approved views rather than ad hoc extracts.
For enterprises trying to reduce BI friction, this is often the real win: less hunting, fewer disputes, and quicker alignment.
Key Features To Look For In A Centralized Reporting Portal
Not every portal improves reporting. Some simply create a new place to store links. A useful centralized reporting portal needs features that make access simpler, safer, and more meaningful.
Role-Based Access And Security Controls
Security is not optional in enterprise BI. Different users need different views of the same reporting environment.
A strong centralized reporting portal should let us:
- Show executives summary dashboards without exposing transaction-level detail
- Give analysts deeper access for investigation and trend analysis
- Restrict confidential data by department, geography, or function
- Maintain auditability for access and content changes
This matters for both usability and risk reduction. People should only see the data that supports their role. That keeps the interface cleaner and supports internal controls.
This is one area where IntelliFront BI is relevant. Its business intelligence portal approach supports shared KPI visibility while still fitting enterprise governance needs.
Automated Scheduling, Distribution, And Alerts
In many organizations, reporting is not just about viewing dashboards. It also involves recurring distribution, triggered alerts, and making sure information reaches the right audience at the right time.
Even so, the portal itself should remain the central access point. Alerts and recurring reporting actions should support that experience, not replace it. A good centralized reporting portal helps users move from passive receipt of information to active exploration in the portal.
Useful capabilities include:
- Notifications for threshold exceptions or high-severity issues
- Consistent report numbering or categorization
- Easy movement from alert to dashboard context
- Clear visibility into current vs. historical performance
Dashboard, Report, And Format Flexibility
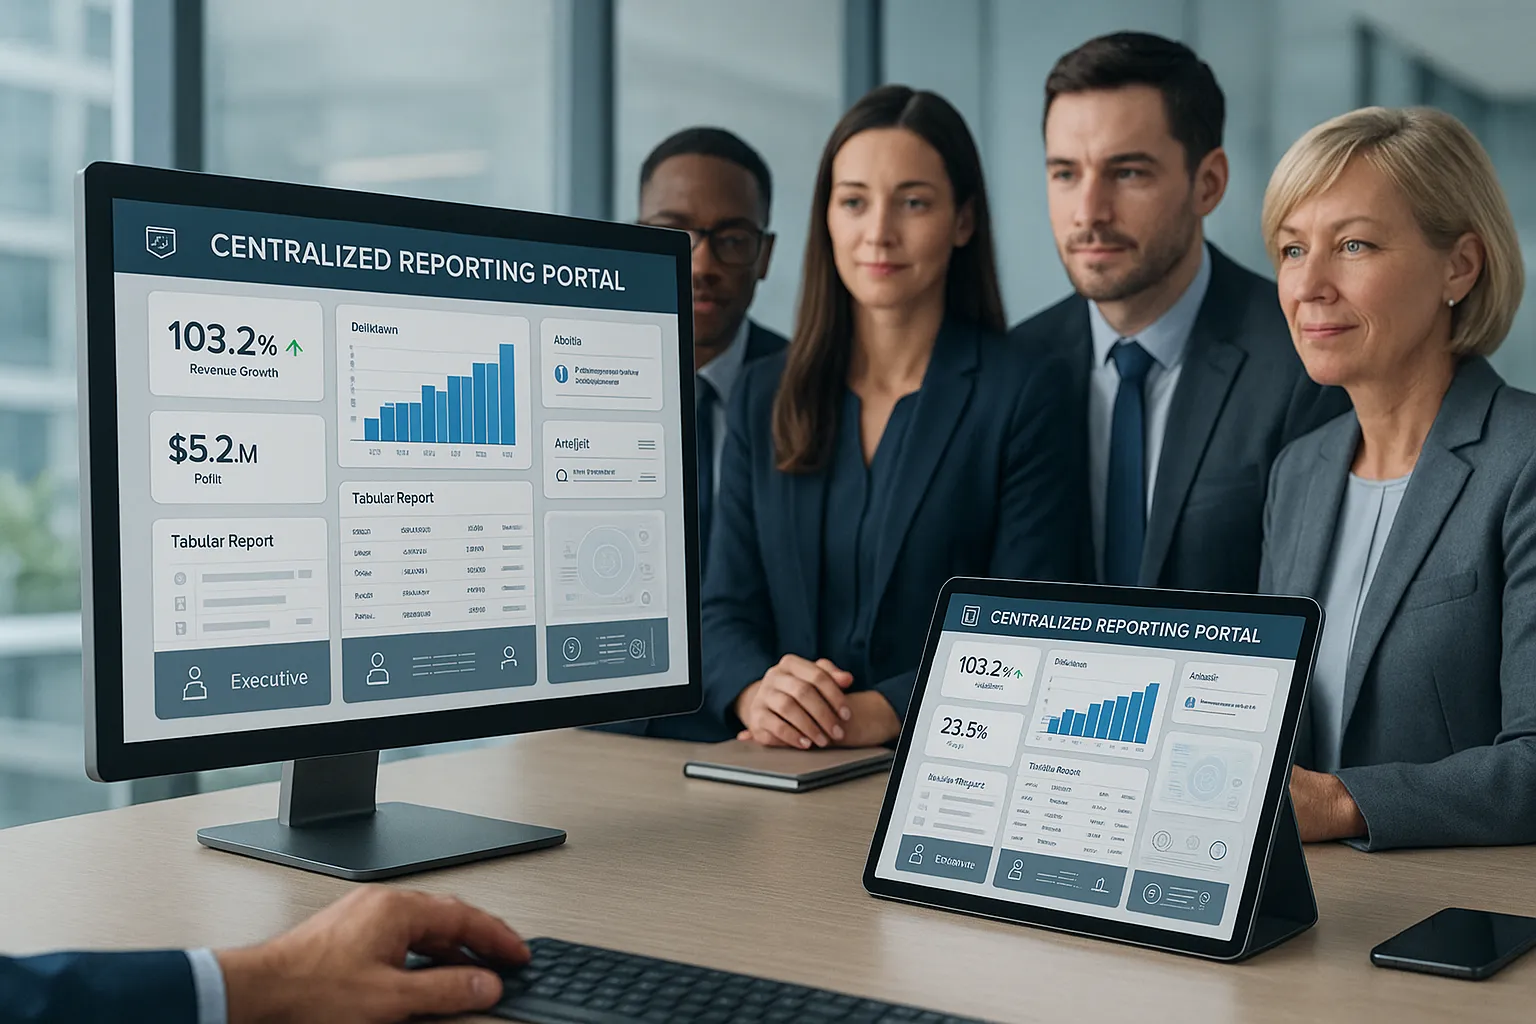
Enterprise teams consume information in different ways. One department wants high-level KPI scorecards. Another wants tabular detail. A third needs trend views with drill-down.
That's why format flexibility matters. A centralized reporting portal should support:
- Interactive dashboards
- Detailed operational reports
- Drill-down and filtering
- Visual summaries and tables
- Mobile-friendly or browser-based access
This flexibility increases adoption because users do not all think the same way. The portal should adapt to business questions, not force everyone into one rigid format.
IntelliFront BI connects well here because it is designed for KPI dashboards, analytics views, and business-friendly data presentation from a central interface. The product page gives a useful overview of how organizations can present metrics and dashboards in one place.
How A Centralized Reporting Portal Supports Better Decision-Making
A centralized reporting portal improves decision-making by reducing the delay between question and answer. When users trust where the data lives, they spend less time validating reports and more time acting on insight.
That changes the pace of meetings. Instead of debating which spreadsheet is current, teams can focus on performance, trends, and next steps.
There are a few specific ways this happens.
First, visibility improves. Leaders can see cross-functional metrics in one place rather than piecing together updates from separate tools.
Second, context improves. Users can move from summary KPIs to detail views, which makes it easier to explain why a number changed.
Third, consistency improves. Shared definitions reduce argument over terminology and keep teams aligned on the same measures.
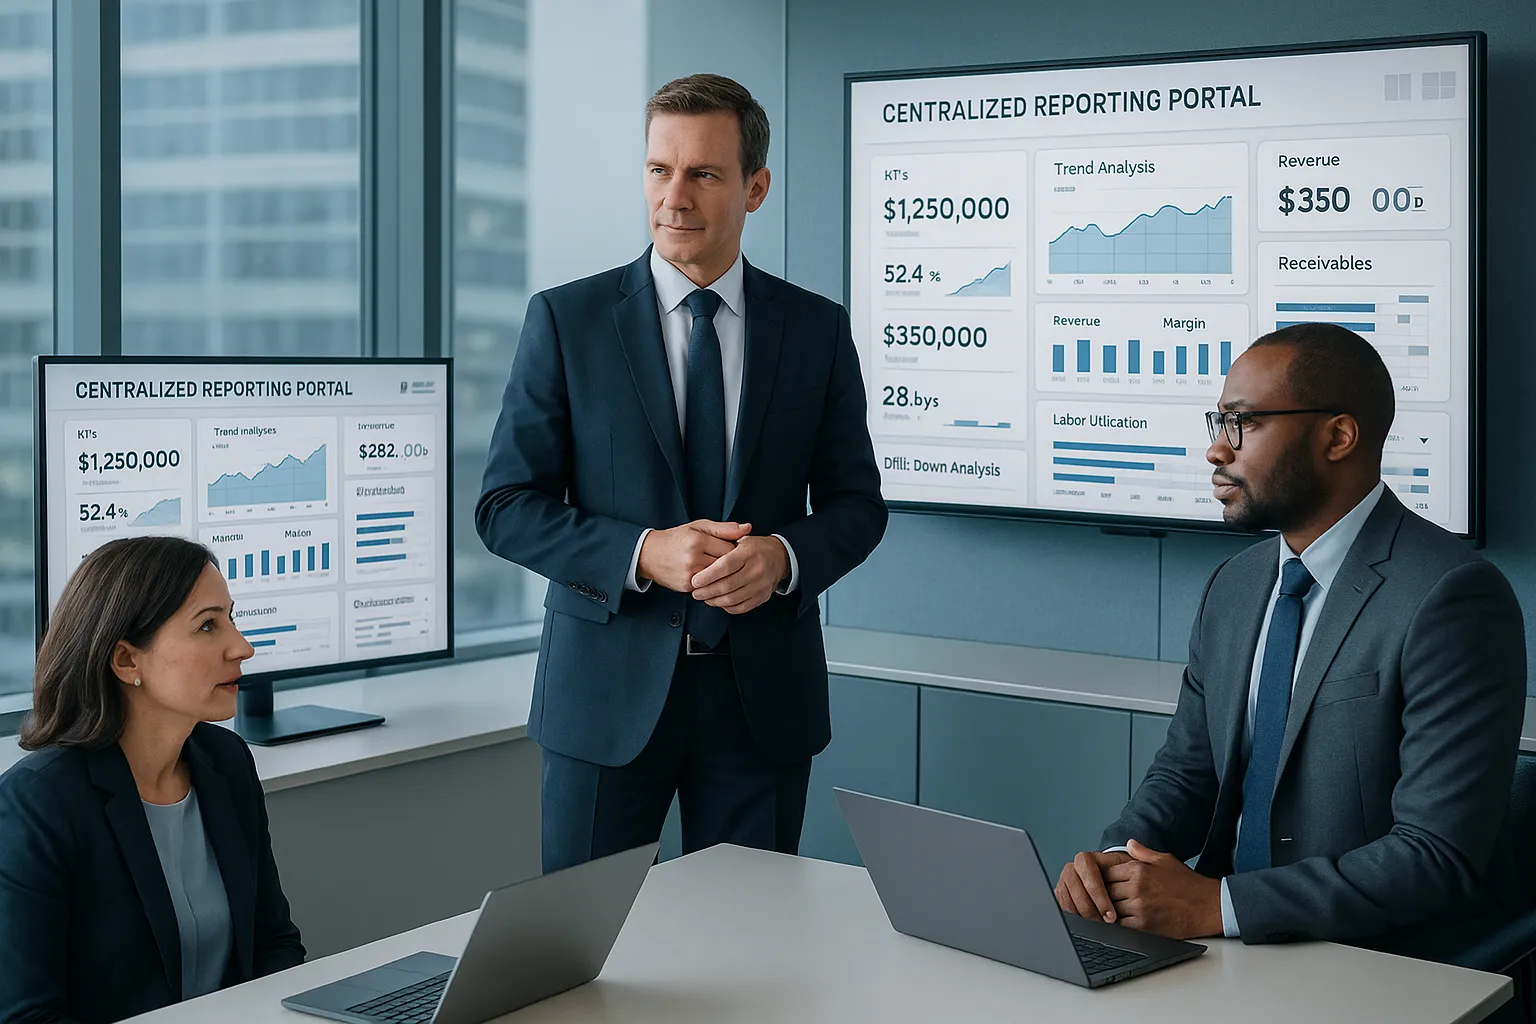
Consider these business use cases:
- A COO reviews service backlog, labor utilization, and customer wait times from one portal before a weekly operations call
- A CFO checks revenue, margin, and receivables dashboards in a single workspace instead of comparing files from multiple managers
- A compliance lead monitors incident trends and open remediation items from one governed source
- A regional VP uses drill-down views to compare branch performance without requesting separate reports from each office
This is also where a centralized reporting portal supports a healthier BI culture. People are more likely to use analytics when access is simple. If finding a trusted dashboard takes five clicks and three permissions requests, usage drops. Fast.
And when we connect that idea to IntelliFront BI, the value is straightforward: the software gives organizations a central place to present KPIs and analytics in a way that business users can actually consume. That makes the portal not just a storage layer, but a decision support layer.
Best Practices For Implementing A Centralized Reporting Portal
A centralized reporting portal works best when we treat it as an operating model, not just a technical deployment. The portal should define how people find, trust, and use BI content across the business.
Define Governance, Ownership, And Access Rules Early
Start with governance before rollout. If ownership is unclear, the portal fills up with duplicate or outdated content.
We should define:
- Which team owns each dashboard or report
- Who approves changes to KPIs and definitions
- Which roles can view, edit, or administer content
- How archived content will be handled
This avoids confusion later. It also prevents the common problem where "temporary" reports become permanent unofficial sources.
Standardize Report Delivery Across Teams
Standardization matters even when teams have different goals. Sales, finance, and operations do not need identical dashboards, but they do need consistent naming, layout logic, and navigation.
Good standardization usually includes:
- Common KPI labels and business definitions
- Shared folder or portal structure
- Consistent branding and report layout patterns
- Clear drill-down paths from summary to detail
A portal that feels predictable is easier to adopt. Users should not need training every time they switch from one department's content to another.
Measure Adoption, Usage, And Reporting Efficiency
If we do not measure adoption, we cannot know whether the centralized reporting portal is working.
Track simple indicators such as:
- Active users by department
- Most-viewed dashboards and reports
- Search or access patterns
- Time saved in report retrieval or meeting prep
- Reduction in duplicate report requests
Usage data tells us what users value and where the portal still creates friction. In many cases, low adoption is not a data problem. It is a design or governance problem.
A practical rollout approach is step-by-step:
- Audit current reports and data sources
- Identify high-value use cases by team
- Define governance and access policies
- Build a simple portal structure first
- Launch with a focused pilot group
- Review usage and feedback
- Expand in phases
That approach keeps the centralized reporting portal useful from day one instead of turning it into a massive cleanup project.
Conclusion
A centralized reporting portal gives enterprise teams something they often lack: one trusted place for BI access, KPI visibility, and consistent reporting.
When we centralize reporting well, we reduce friction, improve governance, and help decision-makers move faster with more confidence. That benefit shows up in finance reviews, operations meetings, compliance oversight, and executive planning.
For organizations looking at solutions in this space, IntelliFront BI from ChristianSteven is worth reviewing because it aligns closely with the core goal of a centralized reporting portal: bringing dashboards, analytics, and business metrics together in one controlled environment. The product page is the best starting point, and the IntelliFront BI knowledgebase offers deeper guidance for evaluation and implementation.
The big idea is simple. If people can't find or trust the data, reporting does not help much. If they can, better decisions follow.
Key Takeaways
- A centralized reporting portal provides a single, trusted place for accessing BI dashboards, reports, and KPIs, reducing version confusion and data silos across departments.
- Role-based access and security controls are essential to tailor views by user role, protect sensitive data, and maintain audit trails for enterprise compliance.
- Automated scheduling, alerts, and distribution integrated with the portal enhance timely delivery of reports while keeping users engaged in active exploration.
- Flexible report formats, including interactive dashboards and drill-down capabilities, increase user adoption by accommodating various business needs and preferences.
- Implementing governance with clear ownership, standardized report design, and phased rollout ensures consistent, efficient use of the centralized reporting portal.
- By streamlining data access and improving report consistency, the portal accelerates decision-making and builds confidence in business insights.
Frequently Asked Questions about Centralized Reporting Portals
What is a centralized reporting portal and why is it important for enterprises?
A centralized reporting portal is a single digital platform where approved reports and dashboards from multiple systems are accessed. It reduces data silos, ensures consistent reporting, and improves security and decision-making across departments in enterprises.
How does a centralized reporting portal improve business intelligence access?
By consolidating BI dashboards, KPIs, and reports into one governed environment, it simplifies user access to trusted data, reduces time spent searching, and ensures everyone uses consistent, up-to-date information for faster insights.
What key features should I look for in a centralized reporting portal?
Look for role-based access controls to secure data, automated scheduling and alerting for timely report delivery, and flexibility in dashboards and report formats to meet diverse business user needs and support drilling down into details.
How does role-based access enhance data security in a centralized reporting portal?
Role-based access restricts data visibility based on user roles, ensuring executives see summaries while analysts access detailed data, protecting sensitive information and maintaining audit trails to meet compliance requirements.
What reporting challenges does a centralized reporting portal solve in large organizations?
It addresses scattered report access by consolidating data, standardizes report formats to reduce confusion, controls report quality to prevent errors, and supports compliance with auditability and permission management.
What are best practices for implementing a centralized reporting portal effectively?
Define clear governance and ownership roles early, standardize report delivery and naming conventions across teams, measure portal adoption through user activity and feedback, and roll out the portal gradually to ensure usability and continuous improvement.

No Comments Yet
Let us know what you think