Share this
by Christian Ofori-Boateng on Jun 10, 2020 1:35:50 PM
Benefits of Using Power BI
Microsoft Power BI is your ultimate business intelligence tool that enables you to visually analyze your data and make more informed decisions for your enterprise. There are various benefits of using Power BI, which is why it has become quite popular. Many organizations are using Power BI because of its functionality and ease of use. If you are a data-driven organization looking for a powerful business intelligence tool, Power BI is your answer. Power BI helps you visualize your raw data by building an abstract layer on top of it.

1. Powerful Reporting
You can gain perspective regarding the benefits of using Power BI by reading various online Power BI blogs that will inform you of its features. Using Power BI tools, you can generate different types of reports and schedule them as per your needs. If you have multiple recipients interested in your reports and they desire to receive them at different frequencies, Power BI makes it possible to do so. Power BI also gives you customized visuals and delivers reports in different formats. You can share Power BI reports in a static format or a dynamic format, depending on the needs of each individual.
2. Easy to Use
Business analysts no longer have to use laborious Excel worksheets to process data. When you start using Power BI tools, your life becomes much more productive and efficient. Another advantage of using Power BI is its easy integration with various data sources. You can efficiently organize your data and generate reports that can be shared with key stakeholders in your organization.
3. Dashboards and Metrics
Power BI dashboards are yet another important feature that you can utilize for your business intelligence needs. You can also create dashboards for your company metrics and KPIs. Imagine seeing all your metrics from different departments on a single dashboard. You can track company goals, revenues, etc. on your Power BI dashboards. Dashboards are also very useful to senior management for making important decisions.
ChristianSteven Software has been a leader in developing business intelligence solutions for many years. We strive for excellent customer satisfaction in all our BI products. Power BI tasks are complex, and automation tools can provide greater efficiency. PBRS (Power BI Reports Scheduler) is one such tool that can enhance the benefits of using Power BI. It will help you generate and distribute reports with ease.
Sharing Power BI Reports and Dashboards
Sharing Power BI Reports
Depending on how large your enterprise is, you may have varying requirements to schedule and export Power BI reports. When you share your power BI reports, they can be also printed and shared with others. You can use the Power BI PDF report option to share a PDF version of your reports. The PDF format is an excellent way to share a static view of your company report. You can select the destination as a PDF file and export the report in a PDF format. Users will not be able to modify or access your data with a Power BI PDF report which makes it more secure.

Print a Power BI Report or Dashboard
Printing Power BI reports and dashboards is very easy. You can print an entire dashboard, a dashboard tile, a report page, or a report visual from Power BI service. Simply select the report page(s) you are interested in and send it to the printer.
As far as printing a dashboard is concerned, it is the simple task of opening the dashboard that you would like to print and choosing “print dashboard.” After selecting your print settings, you are all set to go. Of course, with all the charts and graphs, a color printer is a good choice to help you visualize the report better.
You can also save your selected dataset or a dashboard as a PDF file. You can directly save your entire dashboard as a PDF and share it with key stakeholders in your enterprise. This is a nice feature, especially when you don’t have access to a printer, or you simply need to share it with interested parties.

Share via Email
When tasked with sharing your reports with various stakeholders in your organization, you can share Power BI reports, and Power BI Paginated Reports, by email. You can also set the frequency at which these emails are sent so that you are not bombarding their inbox but still providing valuable information. Additionally, you can share Power BI dashboards to keep all the different departments of your organization on the same page.
Share via Dashboard
Power BI dashboards are another great way to share data insights. Dashboards are a great means of keeping everyone on the same page. Dashboards are also a useful tool during business meetings. Companies have fiscal goals and important KPI metrics that track these goals throughout the year. Dashboards can play an important role in tracking these KPI metrics and adjusting strategies to align with company goals.
Intelligent Reports
You can create powerful reports using Power BI features and share these reports with your colleagues and customers. You can also export these reports to different formats such as Excel or PDF. Various departments in your organization may have different needs for data reports. Your report recipients may prefer receiving them in different formats, and it is ideal if you can export the data into these desired formats. PDF is an accessible format since it provides additional security and is read-only. Each page in your Power BI report can be exported as a PDF page and will be easily readable and shareable.
Export as Excel
Excel formats are also quite prevalent in businesses. PBRS also enables you to export Power BI reports in Excel format for consumption by your clients and colleagues. Since Excel has a lot of business-related features and functionalities, it is convenient to get Power BI reports in Excel format so that these features can be directly used on the data reports.
Scheduling Power BI Reports to CSV Format
PBRS is a Power BI reporting solution that allows you to send and schedule unlimited reports to unlimited users with only ONE Power BI license. Want to learn more about PBRS? Get a free trial.
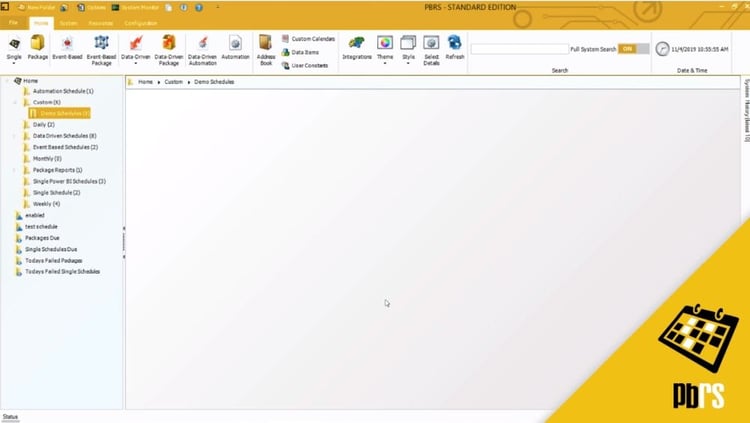
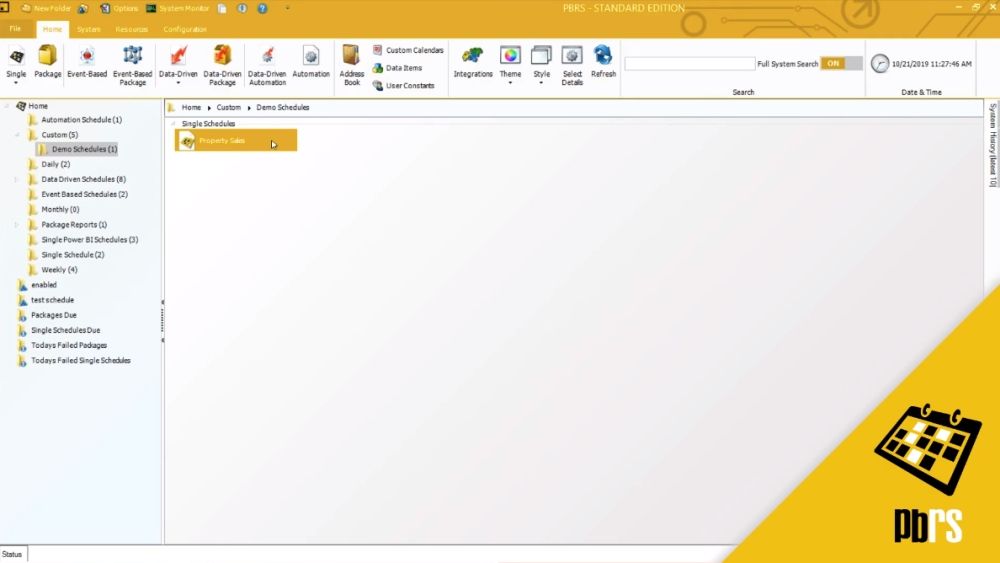
In this demo we'll show you how to export a single Power BI report to CSV format. The schedule is going to be set to run on the last day of every month at 11:00 PM. To begin we will select single for Power BI. we'll set the Power BI account, and the report that I want to run (for this example we will run a sales report). Click next to save that information.
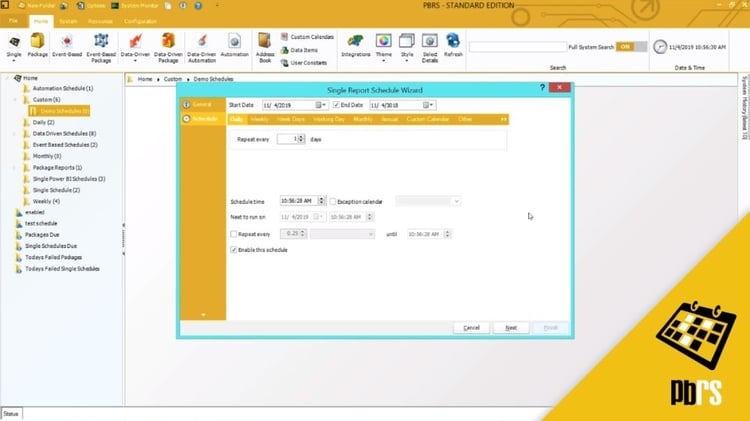
This is the scheduling tab and for this we want to run it monthly, and we want to run it on the last day of every month. The scheduled time is going to be 11:00 PM, so we will just overwrite what is written there. For more information on scheduling, please view the scheduling demo. Click next to save it.
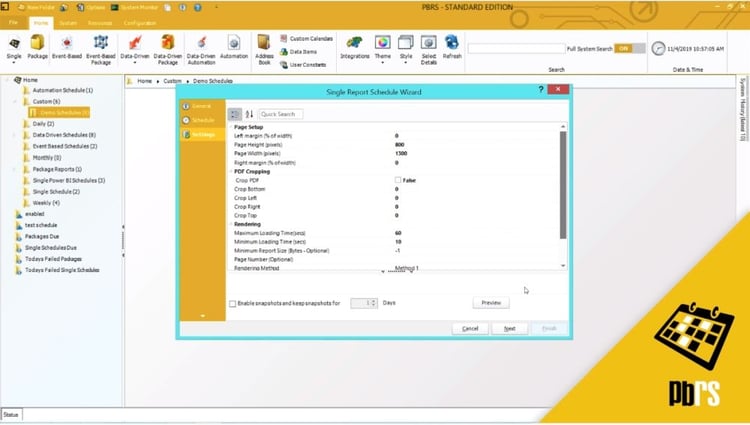
This is the settings tab, and if you wish to format the PDF output, you can do that here. So if you want to change the page width or the page height, you would simply click and over-type whatever you want the page height to be. For this example we don't have any changes to make here, so we'll just click next.

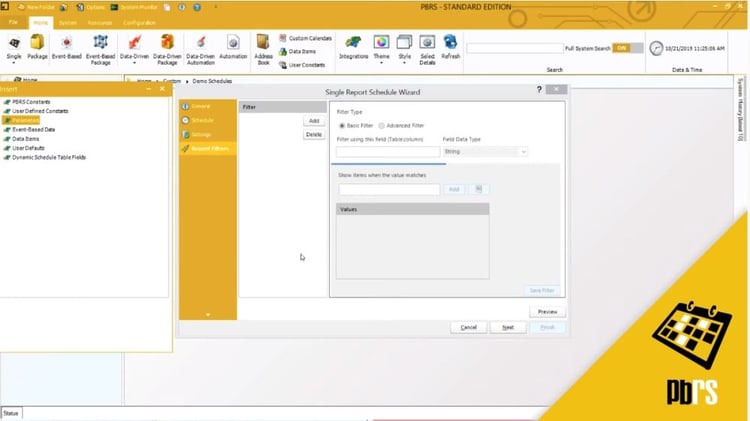
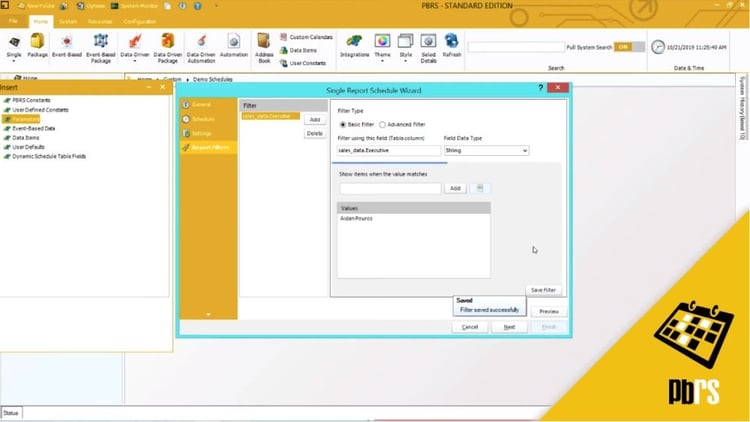
This brings you to the report filters tab. This is where you enter the report filters. This example report has a filter of a sales executive, so we'll enter that now. So just click add, and here you will enter the table and then the column that holds the value that you need. And it is a string, so we will accept that. The salesperson we will run the report for we will enter here and then click add. As you can see, the filter has saved successfully.
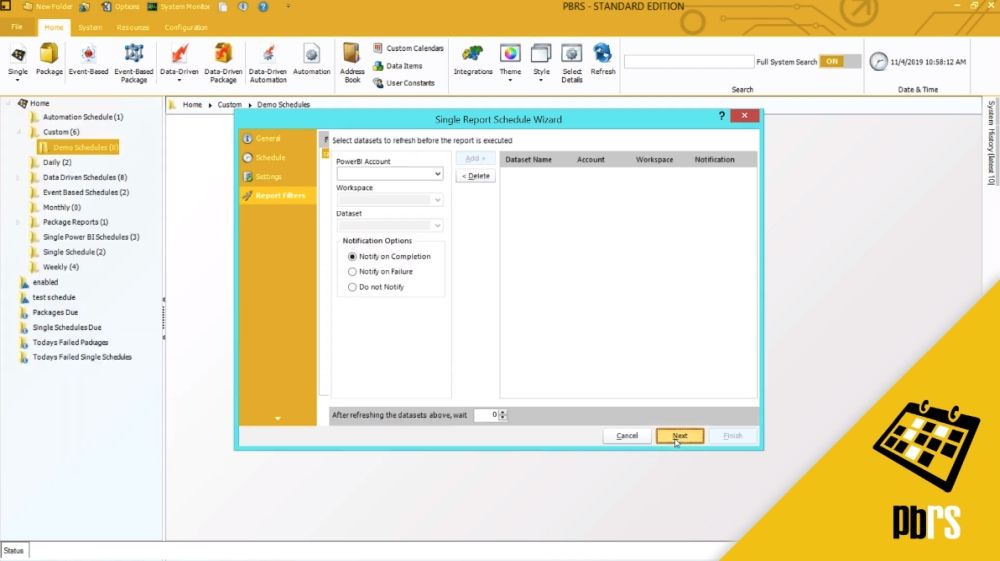
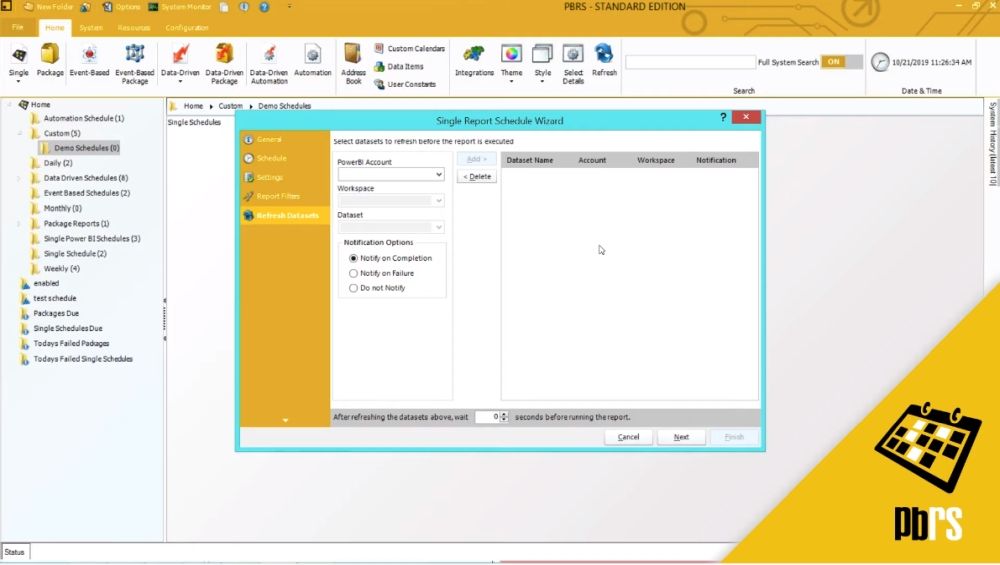
Click next and it will give you the option to refresh datasets. If you want to refresh the data set before executing the report, you would do that here. For this example we don't want to, so we'll go ahead and click next.
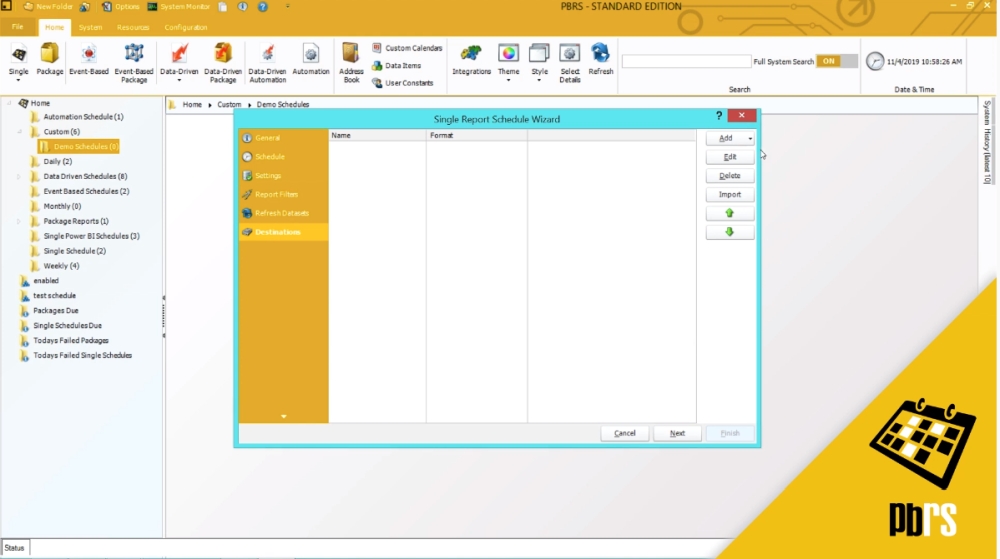
This is where we add the destination. We will use a disk and then the folder, and the format that we'll use is CSV. And then we just need to choose the visual that we want to output to CSV. You will need to wait just a few moments while this loads and then you have the option to add. For the example, we want to do the sales by year, and we are going to export summary data. The format options are how you want to separate the information with a character or a tab and what delimiter you want to use. For this we will accept the defaults. Click okay, and here we have the destination.
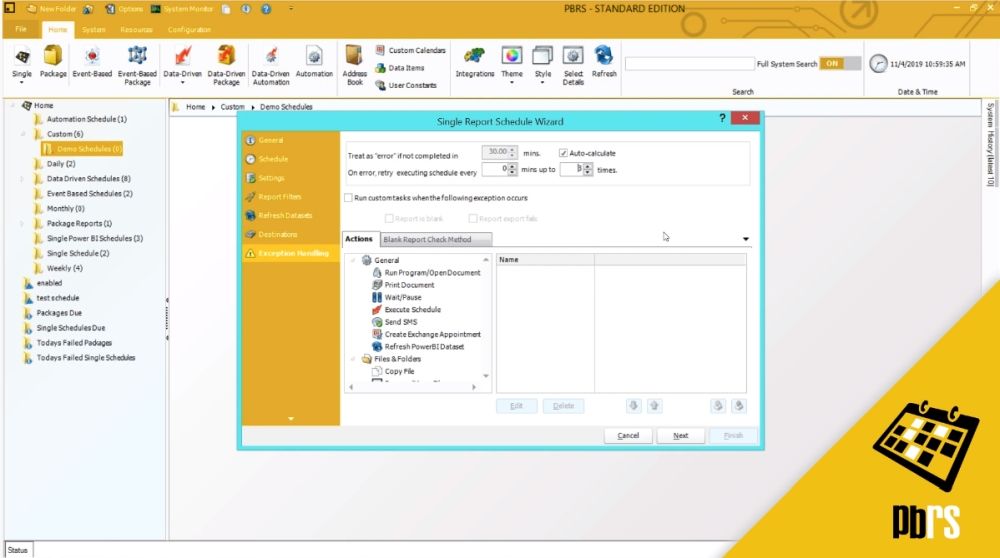
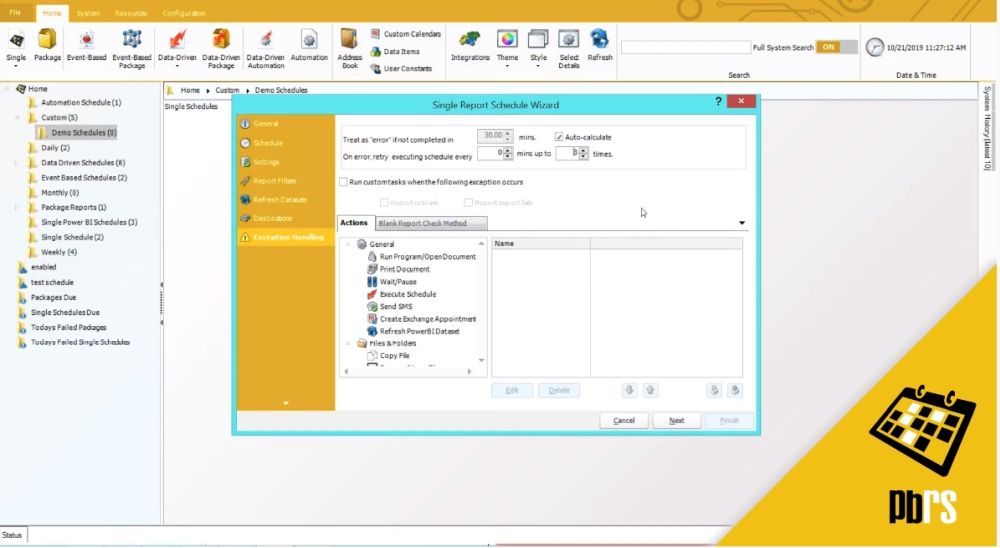
This is the exception handling. For more information on exception handling, please view the exception handling demo.
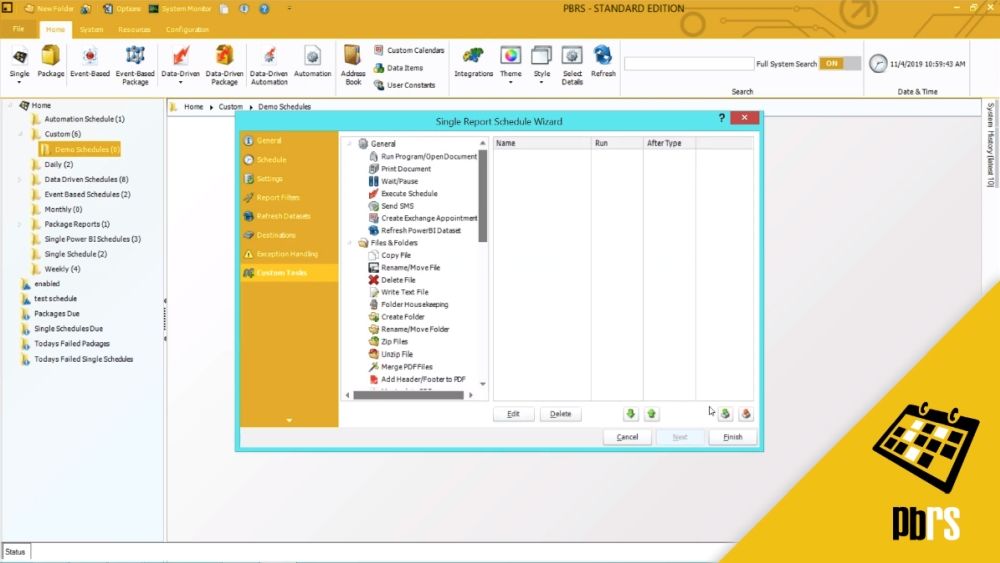
Custom actions. Again, for more information on custom actions, please view the custom actions demo.
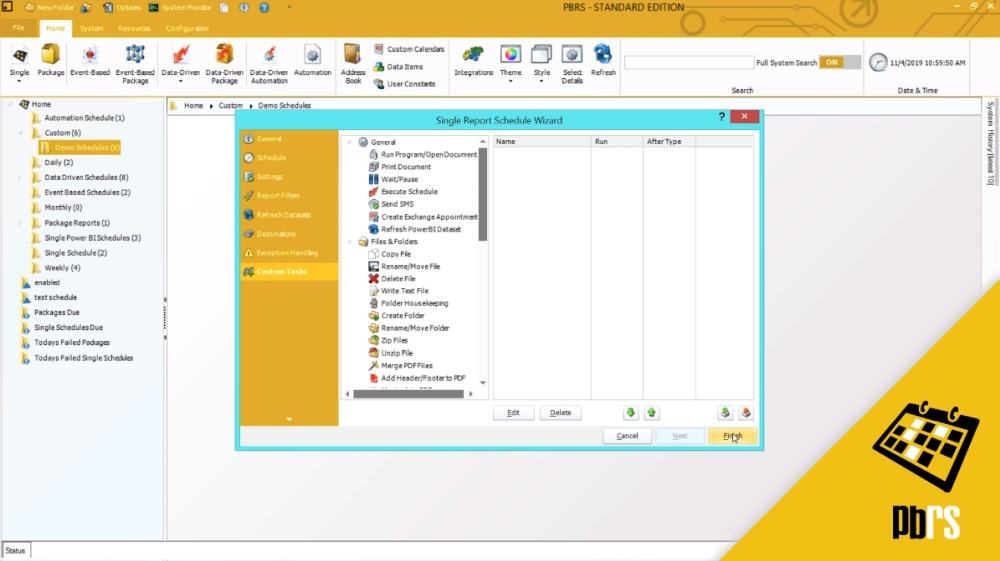
Click finish to save the schedule. That is now saved, but to show you the output, we will go ahead and execute this schedule manually, so just right click and execute. The report has now been executed. So for you to see the resulting output we will just select it and open it with Notepad. And there you have the CSV file.
Want to try for yourself? Start your FREE trial below.
How to Send Power BI Reports to SharePoint
One of the advantages of Power BI is that it allows you to send reports to SharePoint. Because SharePoint is a collaborative software, there are multiple advantages to using it. This is especially true when you want to share your reports with multiple users within your organization or even with your customers.

Use PBRS for Efficiency and Flexibility
Using PBRS, you can simply export reports and dashboards straight to Microsoft SharePoint libraries, folders and lists. You can also create schedules for generating reports depending on your clients’ needs. For instance, you can choose a particular day of the week and set a frequency for repeatedly generating your reports. You can even choose a particular event as a trigger to generate your Power BI reports.
Using the intuitive interface of PBRS, choose SharePoint as a destination for your scheduled reports. If you are sending a dashboard to SharePoint, you can choose to send it as a PowerPoint file. PBRS provides a lot of flexibility to choose filenames and attach messages with your reports. Best of all, it also provides a customer friendly interface.
Using Filters in PBRS
This demo, we'll take a look at report filters. We will demonstrate how to select two report filters from a sales report. The report for the examples will be set to run on the last day of every month and be outputted in PDF format to a folder on the laptop. To begin, we will select single for Power BI. Then choose the Power BI account you want to use and the report type (for this we will do a sales report). Click next to save that information.

The schedule's going to run on the last day of every month, so we will select monthly. Check this option, and we will choose last day of every month. Then select next to save that information. This is the settings tab. If you want to change any information on the default settings, you can do so by simply clicking and over typing. For this example we don't want to, so we will accept the default and select next.
This brings you to the report filters tab. To add a report filter, select add and type in the table dot column where the information is stored. Keep in mind this information is case sensitive. The first filter we will use is the sales executive. We will confirm it's a string, and we will pull the information back for this person. Once that has been selected simply click add.
Now we will use a date filter, so we want to select add another filter, and again, put in the table and the column. And this filter is actually numeric, so we will need to change that at this point, and for the example we will pull this information back for the last four years up to the present day. Click next to move on.
This is the refresh data sets option. If you want to refresh the data set before running the report, you may do so here. For this we will just click next. For the destination, we will output this to a folder on the laptop, and it's going to be in PDF format. For more information on PDF options, please view the PDF demo. Next to save that information.
This is the exception handling tab. For more information on exception handling, please view the exception handling demo. Custom actions, again, for custom actions and how to apply them in a schedule, please view the custom tasks demo. Now click finish to save the schedule.
Now the schedule is finished. For this example we will right click to execute so we can show you the file that it creates. Okay. Once the report is finished you will see we have the report for this sales executive for the years 2015 to 2019.
Simplify Data Tracking With Power BI Data driven Alerts
Power BI provides a rich and powerful toolset for companies dealing with the loads of data that they process day in and day out. With multiple data driven decisions to make, enterprises are relying heavily on automated tools to streamline their operations. Power BI has a suite of services that help a business analyst meet the demands of the job and keep the executives updated on all data changes.
![]()
Alerts Empower Businesses
Power BI data driven alerts allow users to set notifications when their data hits new highs or lows or if the data takes a dive in the wrong direction. Most data-based companies set fiscal goals and track these goals with key metrics. These metrics display on company dashboards for increased visibility and periodic tracking. Power BI data driven scheduling makes it easier to track these metrics by setting alerts for when a particular metric exceeds a threshold.
Mechanics of Alerts
Power BI data driven alerts only work with numeric data types. These alerts do not work on static data. Power BI software checks for pre-set alerts only after you refresh the data. An alert is triggered when the data has reached a certain pre-set value. By receiving these alerts, companies can take early action and handle business operations with ease.
Benefits of Tracking
Multiple users can be notified using Power BI data driven alerts. This is very important, especially for larger enterprises where data is shared between divisions and may affect businesses in different parts of the organization. Keeping a close eye on important metrics is important for running operations and taking timely decisions.
![]()
Automated filtering, scheduling & distribution of Power BI Reports and SSRS Reports & Dashboards
PBRS™ - the #1 SSRS & Power BI Reports Scheduler - is an intuitive software product that saves time and money by making it easy to automate the filtering, distribution & delivery of SSRS & Power BI Reports & Dashboards - cloud & on-premise. Simply define single or packages of SSRS or Power BI reports, schedule, export them automatically, and send the reports to print, fax, folder, FTP, SMS, Dropbox, SharePoint, Google Drive, Google Sheets, Slack & email in a number of standard formats including Excel, Excel Data Only, CSV, MS Word, PDF, HTML and more.
Distribute Power BI Reports & SSRS Reports
Simply set up a "schedule" stating how often you would like each report to run, whether you'd like the output in Word, Excel, HTML, PDF, PowerPoint, Jpeg format, & more and who it should be sent to. PBRS will do the automated delivery for you, delivering reports to folder, email, printer, Dropbox, SharePoint, & FTP.
Date & Time Scheduling For Power BI Reports & SSRS Reports
It's easy to schedule Power BI Reports & Dashboards to run at a specific date and time, or to run them hourly, daily, weekly, or monthly or set up your own custom frequencies e.g. 4-4-3, every other day, third Monday of the month, and so on. And the same report can be scheduled to be run multiple times with different filter values, formats, frequencies, and destinations. It makes Power BI Reports & Dashboard scheduling simple, hassle-free and convenient for you.
Event Triggers With Power BI Reports & SSRS Reports
Distribute Power BI Reports & Dashboards and respond to your business needs by setting schedules to run based on events and triggers rather than date. Add real-time monitoring to your Power BI Reports and Dashboard distribution process with PBRS's Event Based Schedules, reports are fired off when events occur e.g. database value is present, file is modified, window is open, an email is received, etc. PBRS makes sure the reports are filtered, created and distributed on time and error-free. Just what you want from a Power BI Reports Scheduler.
Data Driven Distribution For Power BI Reports & SSRS Reports
Use PBRS's unique Data Driven Schedule processes to trawl through your database to find the filter values to use and then generate and deliver a unique report for each value. Bring advanced Data Driven functionality to your Power BI Reports & Dashboards.
Pre & Post Delivery Automation
Once your schedule has been executed, why stop there? Use PBRS's unique Custom Actions to run another program, enter values in a database, and modify a file and lots more. Use Automation Schedules for general business process automation without scheduling any reports at all.
Intuitive Interface
PBRS's familiar Explorer-like interface makes it easy to define and schedule report packages. The context (right-click) menus and full copy-and-paste support make it easy to create complex distribution schedules.
Windows Service Scheduler
The scheduling service runs as a desktop application, or as a windows service. It will integrate with Exchange Server, Office 365 or SMTP. Worried about Outlook security prompts? PBRS deals with these expertly - ensuring complete uninterrupted automation.
Use Automation Tools for Efficiency
When you use automation tools, you can eliminate various manual tasks and bring efficiency into your business intelligence world. ChristianSteven Software offers one such tool called PBRS (Power BI Reports Scheduler). PBRS is a feature-rich, intuitive tool that can be used to send Power BI reports by email. It can also be used for scheduling your Power BI reports.
Useful Features of PBRS
When you are using PBRS to share Power BI reports by email, you can choose the recipients from a static list or even from a dynamic list of email addresses. You can also use PBRS to personalize the body of each email to your recipient. These features are very handy especially when each recipient is using the report for a different purpose. Although your dataset may be the same, different departments in your organization may be interested in completely different aspects of your report. PBRS eases the burden on you, and you can become more productive and efficient in your daily tasks.
Need for Asynchronous Communication
With so much data to monitor, there is a greater need for asynchronous communication. Polling for data changes is not practical anymore. Power BI’s suite of tools offers several communication features to keep track of your data changes. You can get Power BI email notifications and alerts whenever relevant data changes happen. Additionally, you can subscribe to getting these email notifications right in your Inbox.
Setup Email Subscription
All you need to do to get started is set up your email subscription functionality. Power BI email notification functionality is only available on Power BI reports. Once you know which Power BI report you are interested in, you can subscribe to get email notifications. Rest assured, you won’t be bombarded with emails. Instead, you will only get notified whenever your pre-set trigger occurs after a data refresh. Depending on how often your data changes, you will receive Power BI email notifications for the data that interests you.
Business Case
By automating repetitive reporting tasks, PBRS ensures that reports are created and distributed when needed, without error, and without costly support time. Business Intelligence where you need it & when you need it.
Business Benefits:
- Quick to set up and simple to use
- Minimize and eliminate repetitive tasks and manual processes
- Reduce costs and cut labor by automating business processes and reports from one application
- Improve customer satisfaction through mass personalized distribution
- Reliable data, and compliance, through automated report generation
- Time and cost savings through streamlined business process automation & SSRS/Power BI Reports distribution
- Leverages existing investments in hardware, software, email and other applications
- Low training and implementation costs
- Low Total Cost of Ownership
Buy Now!
Whether you're spending too much time manually running and distributing Power BI or SSRS output to line managers, or you need to provide corporate management with tailored reports on a regular schedule, PBRS gives you the SSRS & Power BI scheduling tools that you need to automate business reports.
No Comments Yet
Let us know what you think