

NHS PHARMACY · LEARN

What Makes a Useful NHS Hospital Pharmacy Dashboard?

A good pharmacy dashboard helps someone answer a question they have at work. A ward pharmacist should be able to see what still needs review, which ward the list covers and the latest time covered by the records. A service manager looking back over a month needs a different view.

  
CHOOSE THE PURPOSE

Who Is This Dashboard For?

Before visiting North ward, a pharmacist wants to find the prescription items that still need review. A service manager has a different question: how did pharmacy activity change last month? In this example, they use some of the same records, but they need different answers.

The pharmacist needs a short list with enough detail to find each item in the prescribing system. The manager needs a comparison, with the dates and what’s being counted clearly marked. Ask each colleague what they would do after reading the page. Their answers tell you what belongs there.

Start with the reports they already use. If a report gives the pharmacist the right list and makes the ward and update time easy to see, it may already do the job. A dashboard can help when the pharmacist often needs to switch wards or open the records behind a count.

Finish this sentence

“I open this dashboard because I need to…”

A specific answer gives the whole page a purpose. If the answer contains several unrelated tasks, consider separate views.

  
SELECT THE CONTENT

Three Pharmacy Questions, Three Different Views

Our pharmacist's ward visit and the manager's service meeting lead to different design briefs. A third question concerns finding the reporting they use regularly.

Illustrative pharmacy dashboard briefs
Reader’s questionUseful content
What work needs investigation on my ward?A focused summary and the records behind it
How did activity vary over the period?A time comparison with the period clearly named
Which reports do I use regularly?A convenient home view for assigned reporting

The first brief calls for a way to find individual work. The second calls for comparison. The third concerns access and convenience. A single headline number cannot do all three jobs.

For North ward, keep the first draft focused on the ward summary and its underlying records. The monthly activity chart belongs in the manager's view. That leaves the pharmacist with a clear route from the question to the work they came to find.

Give each visual a job

A grid helps someone find records. A trend helps someone compare periods. A headline measure draws attention to a result.

Choose the visual after deciding what the reader needs to understand.

  
DESIGN FOR READING

Make the Important Information Easy to Find

Put “North ward” beside the list title so the pharmacist can see which ward they’re looking at. Name the step in plain language, such as “Prescription items awaiting review”. A list headed “Outstanding” leaves the pharmacist guessing.

Show the count and the items behind it. Give authorised readers the reference they need to find each item in the prescribing system. Put the date and time of the latest records beside the count. If someone needs to check a more recent change, they know where to look.

Give the manager the same clarity. “Prescription items dispensed by week in October” tells them more than “Monthly activity”. Use a written status beside any colour cue, and keep the selected ward, site or dates visible when the reader changes the view.

Read it without the author

Would the page still make sense if its designer were not there to explain it?

A useful title and a few well-placed labels can remove the need for a spoken introduction.

  
CREATE A HOME VIEW

Keep Relevant Reporting Within Reach

A good view still has to be easy to get back to. If the pharmacist uses the same dashboard every morning, a bookmark may be enough. If they also need to see a few measures before the ward visit, it may help to put them together.

IntelliFront BI runs on infrastructure the organisation controls. In it, the pharmacist can put assigned dashboards and key performance indicators (KPIs) on a personal Canvas and choose it as their home view. The manager can start with the activity figures they use. The reporting team maintains the dashboards and the measures underneath.
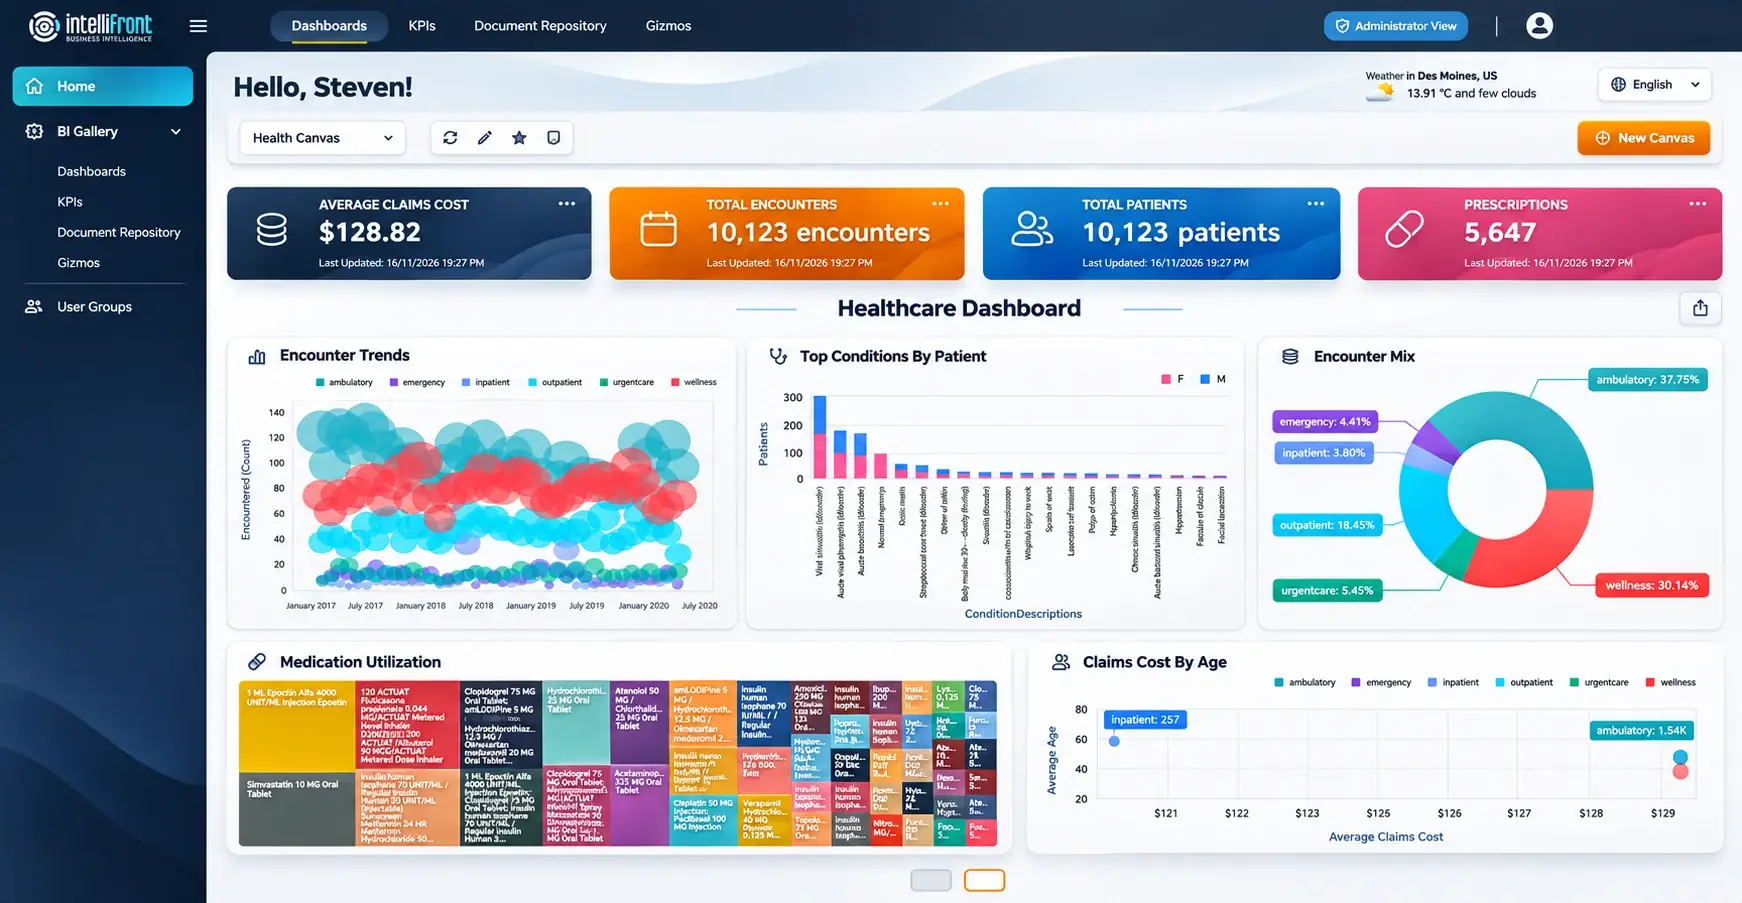

Healthcare Canvas showing KPI cards above assigned dashboard views
A Canvas brings assigned dashboards and KPIs into a personal workspace. View the full Canvas.

Curate the starting screen

A home view does not need to contain every available dashboard.

Keep the reporting the reader returns to most often within easy reach; let the wider collection serve occasional needs.

  
LISTEN TO THE READER

Does the Screen Help Someone Move Forward?

On the first North ward screen, the pharmacist sees a number labelled “Outstanding” and asks whether it means prescriptions awaiting review or medicines still to be supplied. The analyst changes the label to “Prescription items awaiting review” and checks the count against the list for North ward.

When the pharmacist tries it again, they can explain what the count means and find the item they want in the prescribing system. The manager can still compare monthly activity in a view built for that question.

Try the same thing with a colleague who uses your reporting. Give them an ordinary task and see where they pause. You’ll learn which label to change, which detail to add or which chart they can do without.

If your team needs a shared place for those views, explore NHS hospital pharmacy dashboards for prescription review, discharge workload and stock.

Contributors:

Christian Ofori-Boateng

Christian Ofori-Boateng

CEO, ChristianSteven Software