

How to Export Power BI Reports to Excel Automatically
You can automate an Excel export from Power BI, but the route depends on what belongs in the workbook. Use paginated XLSX delivery for a rendered report, a query flow for model rows, or PBRS MS Excel Data Only for selected report visuals. Standard report Export to File does not produce XLSX.
For a monthly workbook, PBRS can repeat the visual selection, export settings, file naming and delivery you would otherwise perform by hand. First agree on the data and check one complete workbook. Then put that proven configuration on a schedule.
- THE DIRECT ANSWER Choose the Automation Method from the Workbook Requirement
- REQUIREMENTS AND LIMITATIONS Define Access, Output Scope and Completion Evidence
- END-USER WORKFLOWS Configure a Repeatable PBRS Visual-Data Workbook
- DEVELOPER AND API WORKFLOWS Use a Query Flow or Paginated API for Different Outputs
- CHOOSE YOUR NEXT STEP Enable the Recurring Export After the Workbook Passes
Choose the Automation Method from the Workbook Requirement
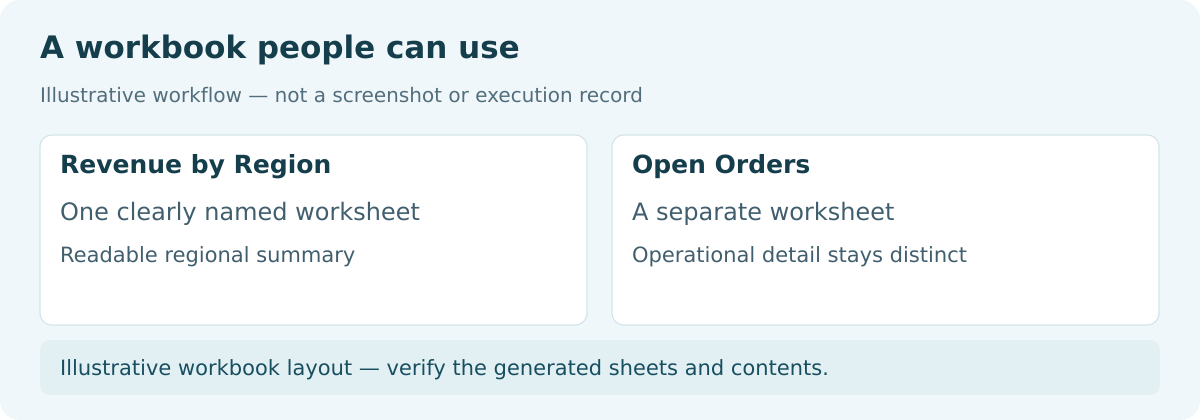
Illustrative workbook layout — verify the generated sheets and contents.
Imagine preparing the same monthly sales workbook for the operations team. They need numbers they can work with, not a picture of a dashboard. Start by deciding which of these outputs meets that need.
| Workbook requirement | Route | First check |
|---|---|---|
| Complete paginated report | Native XLSX subscription or paginated export | Parameters, layout and delivery eligibility |
| Defined model rows | Query results written into an Excel table | Access, complete results and column mapping |
| Selected standard-report visuals | PBRS MS Excel Data Only | Titled visuals, filters and worksheets |
| Standard report page appearance | PDF, PowerPoint or PNG page export | This is a different output from Excel data |
The Export to File format reference limits XLSX to paginated reports. Changing a PDF filename to .xlsx will not create a workbook.
An eligible native paginated subscription can email the complete XLSX report. Check tenant export and subscription settings, licensing and recipient requirements, and keep a paginated attachment below 25 MB. If this meets the job, a separate workbook-writing flow adds unnecessary work.
Also decide whether the team wants a fixed monthly copy or a workbook connected to Power BI for refreshable analysis. Those serve different purposes. Every automation route still needs the relevant source access and its own licensing.
Choose the output before the schedule
Rendered report: Use the paginated Excel route for an entire report.
Model extract: Define the row set a query should return.
Visual data: Select the report visuals the workbook needs.
Fixed or connected: Agree whether the delivered copy should remain a period snapshot.
Define Access, Output Scope and Completion Evidence
Make a manual reference export before building the recurring job. In Power BI Service, open the relevant visual’s More options menu and choose Export data. Use the same filters and summarized or underlying option you intend to automate. The visual export guidance explains access and row-level security; the execution account must have permission to export the required data.
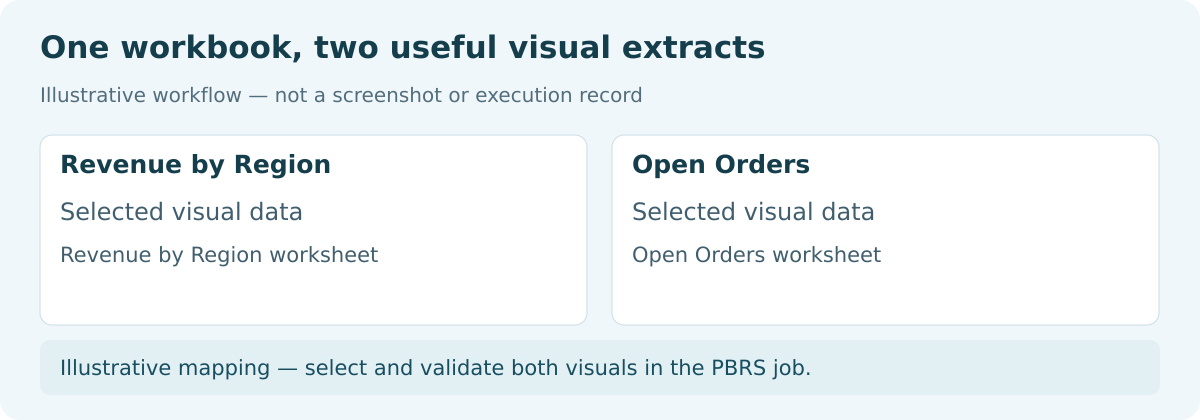
For our illustrative workbook, choose Revenue by Region and Open Orders for September 2026. Record the region, sheet names, required identifiers, expected row counts and totals. Replace these placeholder titles with actual visual titles. No Power BI, PBRS or Power Automate run was performed for this example; obtain the expected results from your approved baseline.
Limits belong to the selected route. The paginated Power Automate integration guide lists reserved capacity A4–A6 or P1/F2 and above, or PPU limited to one export per five-minute window. A download taking more than two minutes fails through that action.
A model query instead needs the tenant’s Dataset Execute Queries REST API setting and Read and Build permissions. Execute Queries allows at most 100,000 rows or 1,000,000 values, whichever comes first, and 15 MB per query. Inspect response errors and counts: HTTP 200 can accompany a limited result.
Agree what a passing workbook contains
Account: Check unattended execution access as well as your own access.
Scope: Write down the period, filters and required columns.
Completeness: Keep reference identifiers, counts and totals.
Route limits: Test the chosen method with a representative workbook.
Configure a Repeatable PBRS Visual-Data Workbook
Illustrative mapping — select and validate both visuals in the PBRS job.
Connect a PBRS schedule to the intended Power BI Service report and account. Apply the reporting filters and set the recurrence, leaving automatic execution disabled until the controlled test passes. This workbook will contain visual data rather than report-page images.
- Open Destinations, name the destination and choose Email. Enter the approved Send To address, subject and message.
- Select MS Excel Data Only (*.xlsx). Open Format Options and choose Add.
- Set the actual Page Number and Visual Title for Revenue by Region. Choose Summarized data to match this example’s baseline, then save that visual configuration.
- Add Open Orders using its actual page and title, with the appropriate export type.
- Choose separate worksheets or a single worksheet using the options available in your application. Give the output a period-specific name that avoids an unintended overwrite.
- Save the schedule and run one controlled test. Open the workbook and compare both datasets with the manual reference exports.
The PBRS Web Application guide documents the destination and visual controls. The PBRS Excel guide explains that a visual must have a title for PBRS to discover it, and covers single-worksheet and date/time naming options.
Open the attachment in the controlled recipient mailbox too. Check the period, identifiers, counts, totals and sheet organization against the generated file. A successful send alone cannot establish that the workbook is right. A flat extract does not turn interactive slicers or DAX definitions into Excel formulas; test templates and formatting separately.

Check the two visual datasets
Selection: Confirm the actual page numbers and visual titles.
Export type: Match summarized or underlying data to the baseline.
Worksheets: Find both required datasets and their expected totals.
Delivery: Open and compare the received attachment.
Let the Application Request the Workbook
Your application can ask PBRS to produce the workbook containing Revenue by Region and Open Orders. That reuses the tested visual selections and delivery destination instead of writing each returned record into Excel in a custom flow.
Keep the workbook’s visual selections in PBRS
Use PBRS resource discovery to obtain the report URL, then GET /api/PowerBiAccount/GetVisualsForReport to find each visual’s exact title and page index. This operation takes a JSON body with AccountId and ReportUrl; use the documented request example.
In the destination, set OutputFormat to MS Excel - Data Only (*.xlsx). Its PowerBIDataOnlyExportSettings collection contains one entry per selected visual. For this example, use summary data and distinct worksheets for the two datasets. The PBRS Excel API guide documents the fields, styling and template placement.
Illustrative visual entry — part of a destination, not a full request
{
"PageNumber": 0,
"VisualTitle": "Revenue by Region",
"ExportType": 0,
"WorksheetName": "Revenue by Region",
"OrderNumber": 0,
"UseExcelTemplate": false
}
Page 0 is illustrative: visual page indexes are zero-based, so substitute the returned index. Add Open Orders using its own actual title and index. Save through the correct Power BI schedule create/update operation and retain the complete intended definition. A schedule-creation response supplies an ID, not workbook bytes.
Release the workbook from the application
When the reporting period is ready, the backend calls ExecuteScheduleAsync for the approved schedule. Keep ExecutionId with the requested period and monitor its result using the execution guide. Open the delivered workbook and reconcile both sheets’ identifiers, counts, totals and period with the agreed baseline. Recurrence can remain in PBRS when no application event is needed.
Choose a different source when the task needs it
Selected-visual export is different from querying arbitrary model rows. For a defined DAX result, a Power Automate Run a query against a dataset flow may still fit; it must create a real workbook and control its writes. A rendered paginated workbook uses a paginated-report schedule or Microsoft paginated export instead. Choose the source that supplies the required data, then verify the file rather than assuming all three routes return the same rows.
Keep the two-dataset workbook dependable
Visuals: Discover exact titles and zero-based indexes for Revenue by Region and Open Orders.
Workbook: Keep the data-only settings inside the destination and give the sheets distinct names.
Execution: Tie the reporting period to the PBRS run and inspect its result.
Reconciliation: Check both delivered datasets against the baseline; visual export is not an arbitrary model query.
Enable the Recurring Export After the Workbook Passes
Choose native paginated delivery for a complete rendered XLSX, a query flow for defined model rows, or PBRS for recurring selected-visual exports. A route without Power Automate is useful when it meets the same output, access and delivery requirements.
Enable recurrence after one controlled workbook and received copy pass. Keep the configuration and evidence so you can compare a later incomplete or stale file. Review that agreement whenever a visual title, query column or report parameter changes.
Explore PBRS scheduling for repeated export and delivery work, or return to Power BI Questions to choose a more specific Excel workflow.
Considering PBRS for recurring Power BI exports to Excel? Share the guide with your colleagues to review deployment, licensing, security and your reporting requirements.
Contributors:
Christian Ofori-Boateng
CEO, ChristianSteven Software

