

Using Pharmacy Activity Data for Seven-Day Service Reviews
Compare the number of items dispensed per day as well as the totals. In this example, weekends account for fewer items overall, but a Saturday averages 80 items compared with 50 on a weekday. The team can then check what made Saturdays busier.
- DEFINE THE QUESTION Start With the Service the Team Wants to Review
- COMPARE LIKE WITH LIKE Turn Unequal Totals Into Daily Averages
- EXPLAIN THE PATTERN Set the Activity Beside Hours and Types of Work
- SHARE THE EVIDENCE Build a View Colleagues Can Explore Together
- MAKE THE REVIEW USEFUL Finish With a Finding and a Focused Next Question
Start With the Service the Team Wants to Review
A pharmacy service lead brings four weeks of dispensing records to a meeting about weekend opening hours. The weekday total is more than twice the weekend total. Before anyone takes that as a sign that weekends are quiet, the analyst checks how many days are in each group.
This example uses one hospital site and four complete weeks, with no bank holidays. Each prescription item is counted once, on the day it was dispensed. The team starts with the pharmacy system’s own report, so everyone can check the figures against a familiar source.
The comparison shows how much dispensing was completed. If the meeting also needs to understand demand outside opening hours or clinical work on the wards, those questions need their own records.
Choose one service boundary
Write the question as “weekend dispensing at this site” or “clinical pharmacy cover for these wards”. Naming the boundary helps colleagues recognise work that belongs in a separate comparison.
Turn Unequal Totals Into Daily Averages
The report contains 1,000 items dispensed on weekdays and 480 on weekend days. At first glance, the weekday total looks much larger. But there are twenty weekdays in the period and only eight weekend days.
| Days included | Items per observed day |
|---|---|
| 20 weekdays | 1,000 ÷ 20 = 50 |
| 8 weekend days | 480 ÷ 8 = 60 |
The denominator is the quantity we divide by: here, the number of days covered. With that included, the service lead can see that the average weekend day had more recorded dispensing activity than the average weekday.
That is a useful finding, and it leads to the next question: are Saturday and Sunday alike? The analyst separates the same weekend total into 320 items across four Saturdays and 160 across four Sundays.
| Day | Items per observed day |
|---|---|
| Saturday | 320 ÷ 4 = 80 |
| Sunday | 160 ÷ 4 = 40 |
The combined average of 60 hid a substantial difference. Saturday now gives the team a more focused starting point than a single “weekend” category. Keeping the individual dates available will help them check whether the pattern recurs or comes mainly from one unusually busy day.
Check every date is accounted for
A complete day with no matching activity contributes a genuine zero. A missing extract needs investigation before the average is calculated. A calendar of expected dates makes the difference easier to spot.
Set the Activity Beside Hours and Types of Work
The service lead recognises the Saturday pattern, but wants to understand when the work happens. The analyst can group dispensing timestamps into locally useful time bands and place those counts beside the opening hours that applied on each date. That helps colleagues ask whether output is spread through the service or concentrated near a particular time.
A dispensing timestamp locates completed work. If the question becomes “When are requests reaching pharmacy?”, the team needs request timestamps instead. Showing the two events separately makes it possible to discuss incoming work and completed output without confusing them.
Let pharmacy colleagues explain the mix
Next, the team considers which activity groups the source can reliably distinguish, such as inpatient and take-home dispensing. The same number of items can involve different work. A useful comparison keeps those groups visible and lets colleagues explain the practical differences.
NHS England’s pharmacy job-planning guidance also covers clinical care and supporting activities such as education, governance and service development. Dispensing figures therefore form one part of the service discussion. Agreed responsibilities, clinical activity and workforce information help the meeting consider the wider picture.
For this review, the analyst keeps the finding precise: Saturday averaged 80 completed items. The team can now investigate the timing and mix of that activity, alongside any available records of outstanding requests and work handled elsewhere.
What does an hourly rate describe?
Dividing completed items by opening hours gives an output rate for those hours. Interpreting staff capacity requires the people, roles and work involved as well.
Build a View Colleagues Can Explore Together
The team can keep using the pharmacy report if it gives them the dates and detail they need. If someone has to rebuild the comparison for every meeting, an IntelliFront BI dashboard can put the day-of-week chart beside the figures for each date. The software runs on infrastructure the organisation controls and uses the data the reporting team prepares.
The screenshot shows a similar way to move from the weekly pattern to individual dates. It counts inpatient orders. Our example counts completed dispensing items, so the chart for this meeting would carry that label instead.
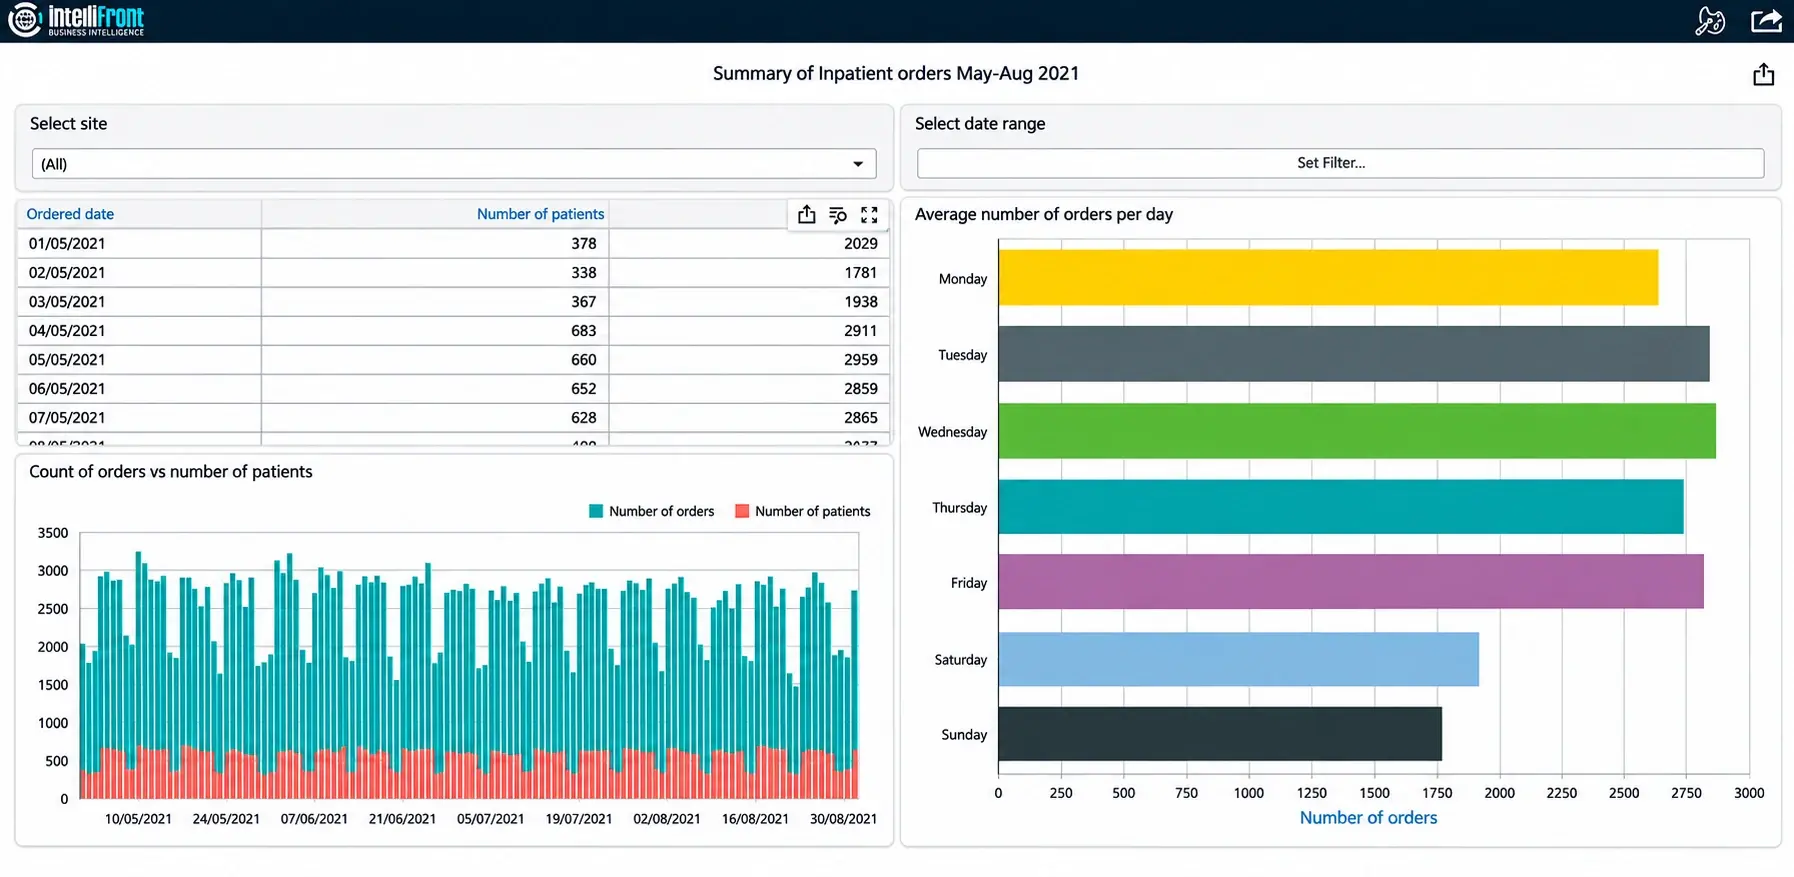
University Hospitals Sussex used inpatient-order and prescription-verification views to help assess its out-of-hours service. For this team’s meeting, start with the dispensing comparison that raised the Saturday question. Add a verification view if the colleagues also want to understand when prescriptions were checked.

Make percentages explainable
For a verification percentage, show which prescriptions qualify for the denominator, what counts as verified and when the status is assessed. A percentage is easier to compare when readers can see the counts behind it.
Finish With a Finding and a Focused Next Question
The meeting now has a more precise starting point: 50 completed items per weekday on average, 80 per Saturday and 40 per Sunday. The analyst keeps the dates behind the figures so the team can see whether every Saturday was busy or one date drove the average.
That changes the next question. Ask what arrived on Saturdays, when the team completed it and whether there was work still waiting at closing time. The dispensing figures open that discussion. An opening-hours or staffing decision also needs evidence about demand and the other work the pharmacy team does.
If your team rebuilds that comparison for every meeting, see how seven-day pharmacy service dashboards can bring weekday and weekend activity into a shared view.
Contributors:
Christian Ofori-Boateng
CEO, ChristianSteven Software