

Self-hosted centralized reporting portal
Bring Your Team’s Reports and Dashboards Together
Less searching for information. More time to act on it.

IntelliFront BI is self-hosted business intelligence software from ChristianSteven Software. Create dashboards and key performance indicators (KPIs), bring existing reports into one portal, and give each reader a personal Canvas—all on infrastructure your organization controls.

- ✓Personal Canvases for the dashboards and KPIs each reader needs.
- ✓Smart Collections that organize reporting around a task or subject.
- ✓Native analytics alongside supported Crystal Reports, SSRS and Power BI content.
Your reports are ready. Your team still has to hunt for them.
A dashboard in one place. A detailed report in another. Colleagues asking the reporting team which link to use. Creating the information is only part of the job when people still struggle to reach it.
IntelliFront BI gives them one reporting destination, with a personal starting view and related content organized around their work. Your reports become easier to find and use, and your reporting team can spend less time pointing people to them.
“Our users like the interface. We can organize our reports, dashboards and KPI's by groups which helps our users find the reports they need quickly.”
University of Louisville
Give Every Reader a Reporting Home of Their Own
Your purchasing colleague needs supplier dashboards and overdue-order KPIs. A personal Canvas keeps those assigned views together, ready for the next review.
They can arrange the views around their work, keep Canvases for different responsibilities and choose a favourite as their home screen. Your reporting team maintains the dashboards and calculations behind them.
When an order needs attention, the reader can open the supporting detail, copy its reference and continue in the purchasing application.
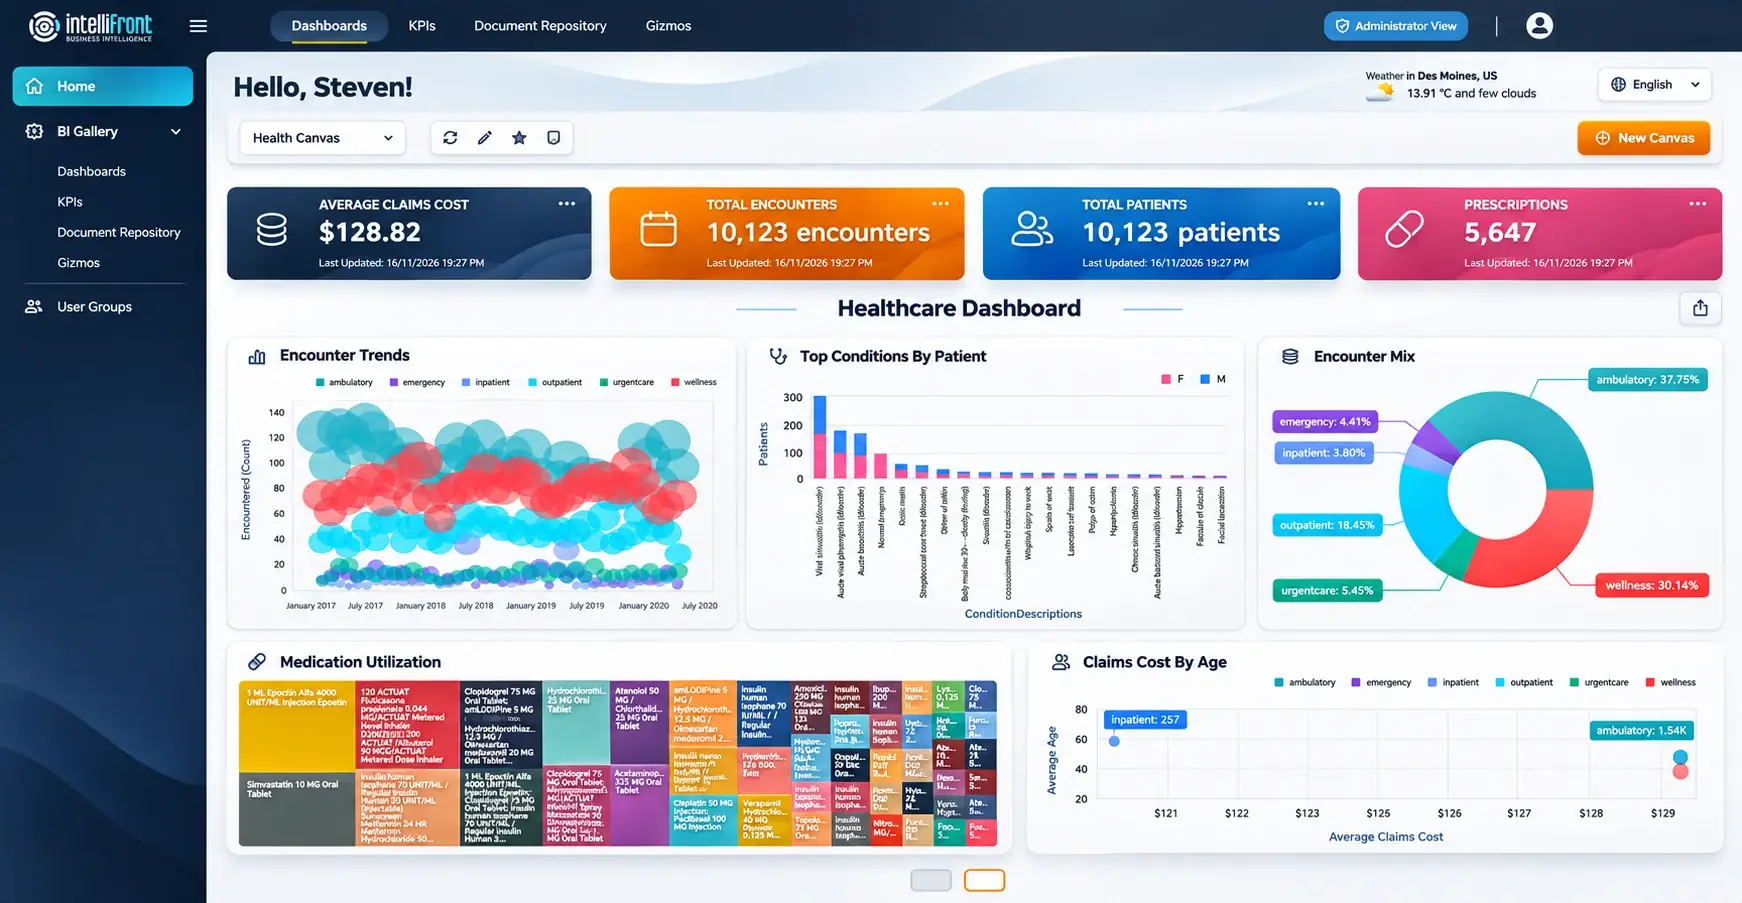
Enhanced Canvas illustration showing healthcare dashboards and KPIs. Click the image or view the full Canvas. See the financial dashboard example.
Make useful reporting part of the working day. See how your team’s dashboards and KPIs could come together in a demo, or explore a personal Canvas in the trial.
Replace a trail of links with a place to look
A purchasing review may need a supplier dashboard, a cost KPI and a detailed spend report. Finding each item should not depend on remembering who sent the link.
Smart Collections bring related reporting together through tags. A collection such as Purchasing gives authorized readers a route to the content for that subject, beyond the dashboards and KPIs on their personal starting view.
Useful descriptions help colleagues recognize the right report. The portal turns a scattered reporting library into a destination they can explore.
Build New Dashboards. Keep the Reports Your Team Relies On.
Create dashboards and KPIs in IntelliFront BI while keeping existing Crystal Reports and SSRS reports available in the same portal. Your supplier dashboard can provide the overview, with a familiar spend report supplying the detail.
Readers have one place to find the reporting available to them. Your team can extend the reporting library without replacing every useful report. Power BI integration is also available, with Microsoft access requirements still applying.
See your reporting together. Explore how IntelliFront BI can bring your existing reports and new dashboards into a clearer reporting home.

Keep Your Reporting Useful as the Library Grows
Your team manages who can open each item, while readers explore the reporting assigned to them. Shared dashboards, calculations and report definitions remain centrally maintained.
Usage records help reporting owners see which content colleagues return to. That gives the team a clearer basis for improving descriptions, organizing the library and deciding which reporting deserves further attention.
IntelliFront BI runs on your organization's infrastructure, giving this reporting destination a home your team operates.

Business Intelligence Backed by More Than 20 Years of Experience
ChristianSteven Software has helped nearly 5,000 organizations in 47 countries with business intelligence and reporting automation. IntelliFront BI brings that experience to your own reporting portal, with personal Canvases, native dashboards and KPIs, and support from the team behind the software.
Questions about your reporting portal
A reader can select a favourite Canvas as their home view. They can maintain several Canvases for different responsibilities, using assigned dashboards and KPIs. The reporting team maintains the underlying dashboards and calculations.
Smart Collections group dashboards, KPIs and reports using tags. Your team can organize content around a subject such as Service Operations, while readers see the items they have permission to use.
Reporting authors maintain the reports, dashboards and KPI definitions. Administrators manage users, groups and reporting access. Readers organize assigned dashboards and KPIs in their personal Canvases.
Yes. IntelliFront BI supports access to existing Crystal Reports and SSRS alongside its native dashboards and KPIs. Power BI integration is also available; Microsoft access requirements still apply.
Yes. Start a 30-day trial to explore IntelliFront BI, or book a demonstration around the reporting your team uses.
Show Your Team a Better Way to Find Reporting
Book a demo around one subject your colleagues regularly ask about. Follow a reader from their personal starting view to related reports in a Smart Collection, then back to the reporting they use most.
Prefer to evaluate it yourself? Start a 30-day trial and bring a small, familiar reporting library together for your team.