

Self-hosted reporting and dashboard software
Create Reports and Dashboards People Can Use
Less rebuilding. More time to understand the results.

Turn prepared business data into reports, dashboards and key performance indicators in your browser. IntelliFront BI from ChristianSteven Software helps your team reuse valuable reporting work and give readers personal Canvases, all on infrastructure your organization controls.
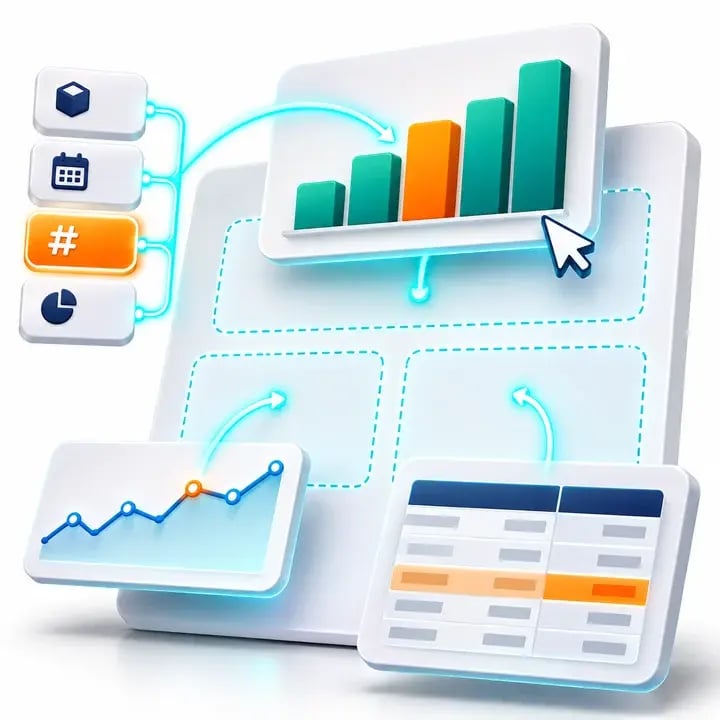
- ✓Create reports and dashboards from prepared business data.
- ✓Reuse calculations and formatting as new questions arise.
- ✓Give readers a personal Canvas for their dashboards and KPIs.
Your next review shouldn’t start with another spreadsheet rebuild
The monthly review is approaching. Your analyst has the actual spending and agreed budgets, but spends valuable time rebuilding calculations, charts and formatting before anyone can discuss the results.
IntelliFront BI gives that work a longer life. Build native reports and dashboards your team can maintain, adapt and share, so the next business question has a useful starting point.
“The output from IntelliFront BI is fast, easy to create, and can be visually stunning – the only limit is our imagination !”
On creating reporting with IntelliFront BI
Bring actual spending and budget into the same view
Which departments exceeded their budget? Where did the difference emerge? A monthly cost review needs a comparison people can understand, with the detail behind it.
Join prepared spending and budget datasets at a suitable level of detail. Build the calculations, tables and charts that explain the variance, with clear periods, labels and currency formats.
Your author develops a maintained reporting design that the team can revisit, instead of rebuilding the review in a spreadsheet each month.
Make the Answer Clear When the Author Is Not There
A cost comparison loses its meaning if one reader sees a monthly figure and another assumes a year-to-date total. Useful starting filters and brief guidance make the reporting easier to use.
Clear actual-versus-budget charts help a manager spot a variance, then explore supporting invoice detail to understand what drove it. They can copy the invoice reference when following up in the accounts application.
Turn the Finished Dashboard into a Useful Daily View
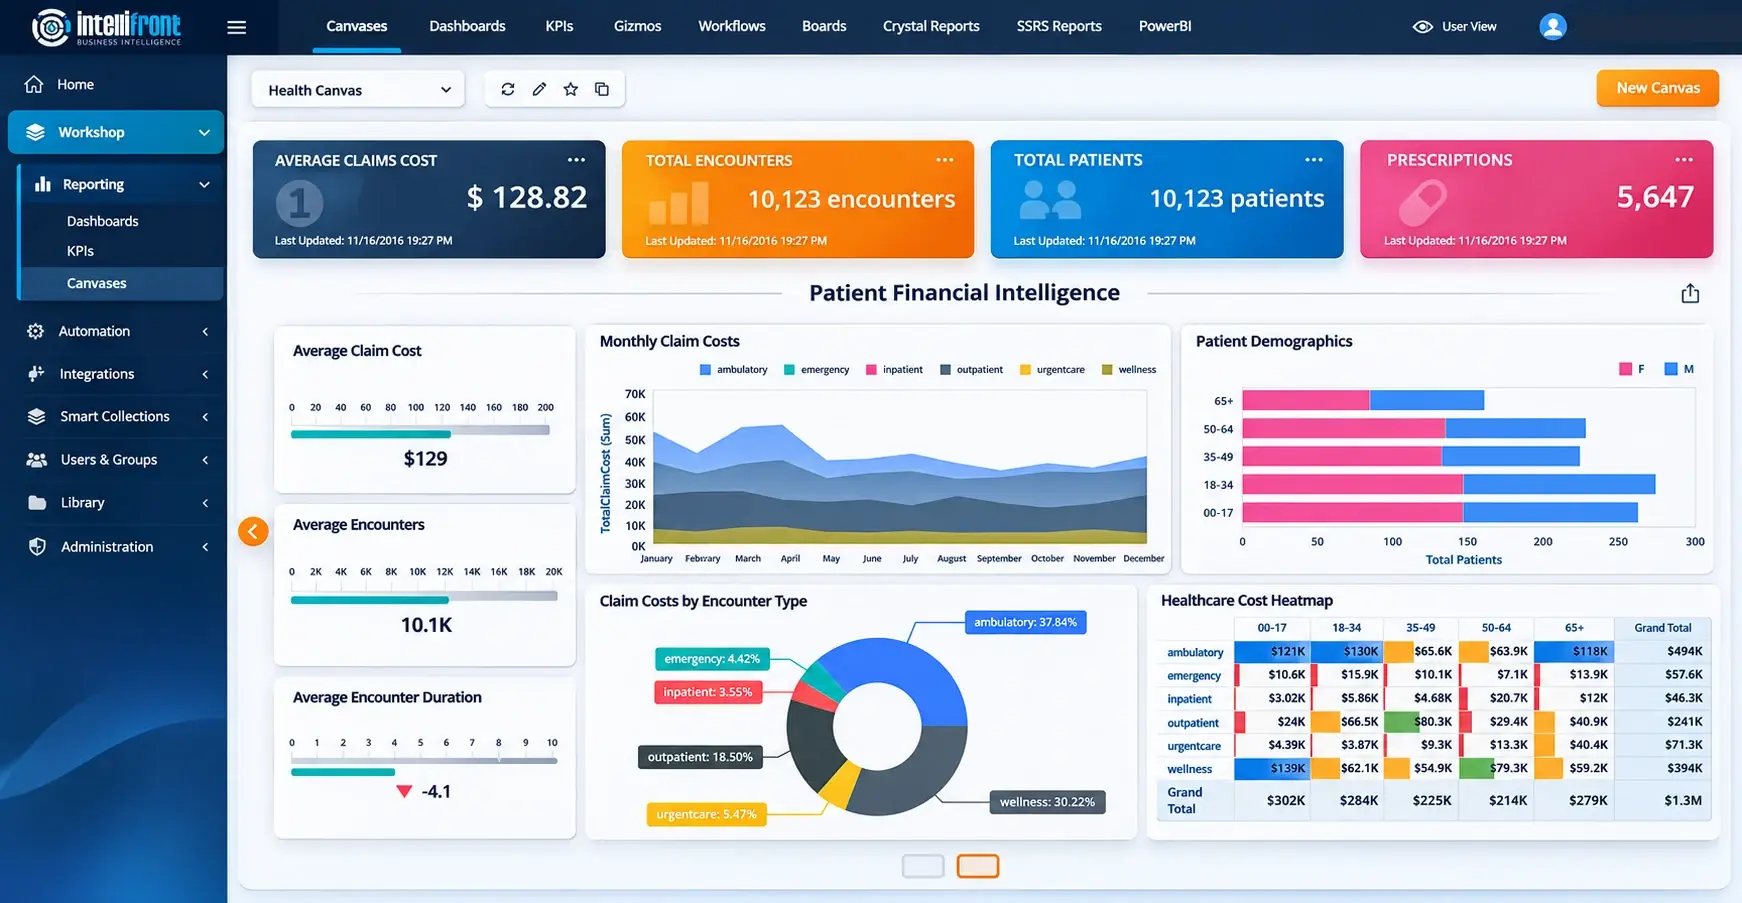
Your authors maintain the dashboard and its calculations. Readers open the assigned reporting in their browser and keep the dashboards and KPIs they need together on a personal Canvas.
The cost review becomes reporting a manager can return to between meetings, with the overview and supporting detail available when a new question arises.
Enhanced Canvas illustration showing a healthcare financial example. Click the image or view the full Canvas.
See what your reporting team could build. Explore a complete dashboard and reader workspace in a demo, or create your first view in the trial.
Let the Next Report Build on Work You Already Did
A second department may need the same cost comparison with different data. Copy calculated fields within or between reports, reuse conditional formatting and carry useful presentation conventions into the next design.
Your authors can adapt the comparison for a new audience while retaining the calculations, labels and formatting that make it understandable.
Bring a reporting design you keep rebuilding. See the work your team could reuse in a demo, or assess the authoring tools in a 30-day trial.

Give Reporting Authors Ownership of the Design
Departmental authors build native reporting in the browser, while your organization operates IntelliFront BI on its own infrastructure.
Work from prepared business data, with your data or IT team supporting source preparation and advanced SQL where needed. Reporting authors can then focus on the measures, views and explanations their audience needs.

Keep Changes Connected to the Reporting They Affect
Before changing a shared dataset, administrators can identify the dashboards associated with it. That gives your team a clearer view of the reporting to review before a change reaches its readers.
Use that visibility to maintain the cost comparison as departments, targets and business questions develop. Your next review can build on reporting your team already understands.
Business Intelligence Backed by More Than 20 Years of Experience
ChristianSteven Software has helped nearly 5,000 organizations in 47 countries with business intelligence and reporting automation. IntelliFront BI brings that experience to your reporting team, with native authoring tools, personal reader workspaces and support as your reporting needs develop.
Questions about creating reports and dashboards
Yes. Reporting authors can build native reports, dashboards and KPIs in IntelliFront BI through a browser. Your team prepares the business data and manages access to the finished reporting.
Yes. Authors can join prepared datasets, such as service activity and a spreadsheet of targets. The data needs matching identifiers and a suitable level of detail so the comparison means what you intend.
Yes. You can copy calculated fields within and between reports and reuse conditional formatting and colour conventions. Check copied calculations against the new report’s data and purpose.
Set useful starting filters and include guidance explaining what the measures cover. Labels, line styles and number formats help readers understand results and targets.
Yes. Readers select assigned dashboards and KPIs for personal Canvases. They can create several Canvases and choose a favourite home view while authors maintain the underlying reporting.
IntelliFront BI is self-hosted business intelligence software. Your organization hosts and operates the platform, with central management of users and reporting access.
See a Monthly Review Become Maintained Reporting
Book a demo around a cost-comparison question. Explore prepared data, a reusable calculation and a readable dashboard, then see how the author can adapt that work for another department.
Prefer to build it yourself? Start a 30-day trial and assess the authoring experience with prepared data your team understands.