

Self-hosted business intelligence API
Give New Users a Reporting Workspace Worth Opening
Connect reporting to the way you welcome new users.

A new account should come with relevant reporting. IntelliFront BI from ChristianSteven Software gives your developers API capabilities to prepare personal Canvases, work with reporting resources and return KPI results—all on infrastructure your organization controls.

- ✓Help new readers arrive at their personal Canvas.
- ✓Bring reporting setup into your application’s workflow.
- ✓Show a relevant KPI result inside your own interface.
Make the first reporting session useful
Your application is ready for a new manager. Their reporting should be ready too: relevant dashboards, clear measures and a personal place to begin. Separate setup tasks can delay that first useful answer.
Connect your onboarding workflow to IntelliFront BI so your team can prepare the reporting experience alongside application access.
Picture a new branch manager’s first day
A branch performance dashboard and two sales KPIs are ready in a personal Canvas, with a chosen home view. The manager starts with relevant information, while your reporting team maintains the content behind it.
Illustrative integration scenario.
Keep reporting useful when responsibilities change
A manager takes on another branch. A new team joins your application. Reporting needs change alongside the people using the software.
Supported operations for users, groups, resources and Canvases give your developers a way to connect reporting updates to those application workflows. Your team can maintain a relevant starting experience as the audience grows and changes.
Make a useful Canvas part of the first session
Connect supported Canvas creation, updates and favourite selection to an onboarding workflow your developers build. Help a reader start with relevant dashboards and KPIs in a workspace prepared for their role.
Your integration supplies the appropriate user context and uses content the reader is authorized to see. Your reporting team maintains the dashboards and measures behind that first view.
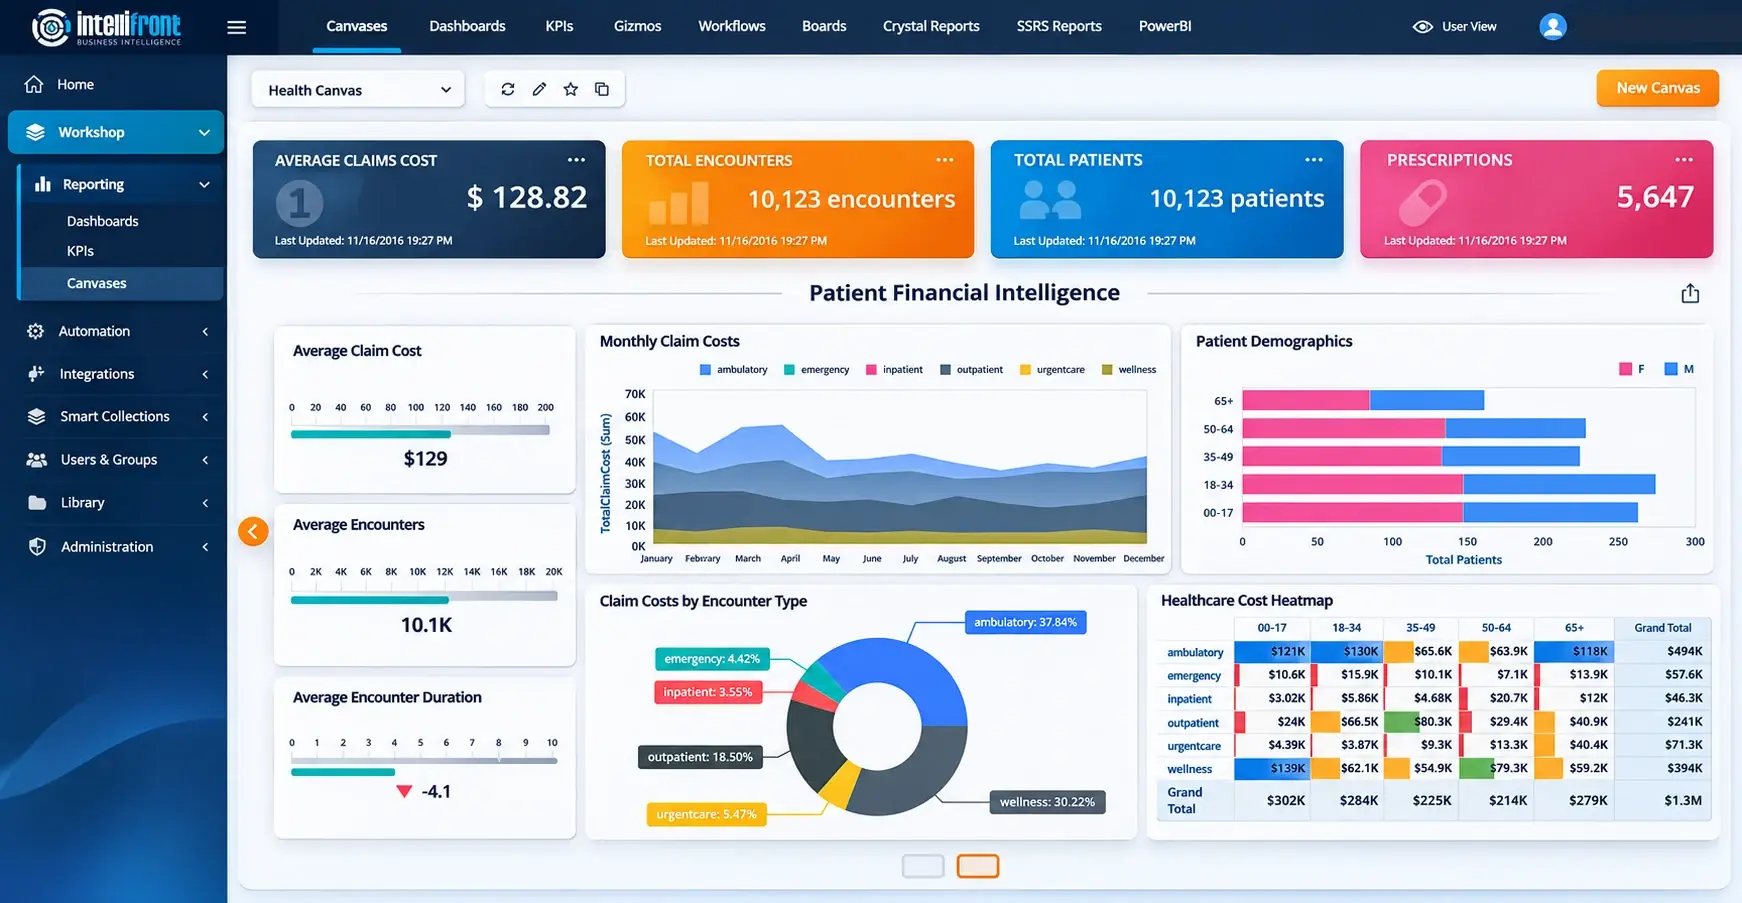
Enhanced healthcare financial Canvas illustration showing the reader workspace.
View the complete Canvas at full size →
Show us the first reporting session you want to deliver. Bring one onboarding workflow to a demo, or assess the documented operations during your 30-day trial.
Spend less effort repeating the same reporting setup
Similar accounts often need similar reporting foundations. Bring supported resource, user, group and Canvas operations into a workflow your developers build around your application.
Reuse approved reporting definitions while adapting connections and access for the intended audience. Your team maintains the reporting behind the experience and checks that each reader reaches the right content.
Explore your own onboarding scenario. Bring one repeated setup task to a demo, or start a 30-day trial to assess it with your developers and reporting team.

Put the useful number beside the work
An application screen may need one result rather than a whole dashboard. An outstanding-work count, for example, can help a manager understand the queue they are reviewing.
The IntelliFront BI API can return a KPI calculation result for your application to present in its own interface. Your developers supply the calculation inputs and handle the response; your team gives the result a clear meaning, unit and reporting period.
Explore the measure your application needs with our team, then reconcile the result against a known calculation during your evaluation.
Keep the integration and reporting service in your hands
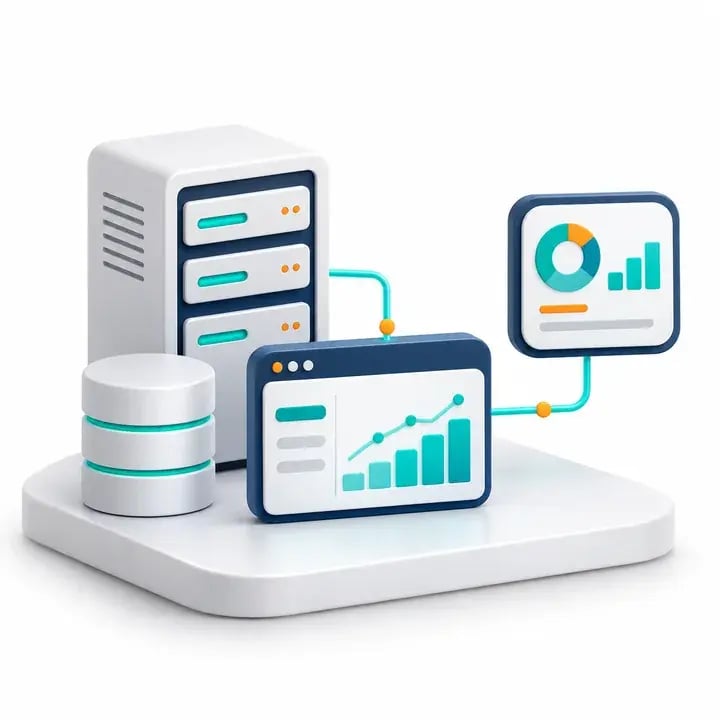
IntelliFront BI is self-hosted. Your organization operates the platform and maintains its reporting content, while your developers decide how the documented API capabilities fit your application.
Connect the moments that matter—from preparing a reader’s workspace to showing a relevant KPI result—with a reporting service your team controls.
Business Intelligence Backed by More Than 20 Years of Experience
ChristianSteven Software has helped nearly 5,000 organizations in 47 countries with business intelligence and reporting automation. IntelliFront BI brings that experience to application-led reporting, with native dashboards and KPIs, personal Canvases and support for the team building and maintaining your reporting service.
Questions about IntelliFront BI API integration
The business intelligence API provides operations for supported reporting resources, users, groups and personal Canvases, plus KPI results. Your developers can connect these capabilities to the setup and reporting workflows in your application.
Yes. Canvas operations include creation, retrieval, updates and favourite selection. They let your application help prepare a reader’s starting workspace using assigned dashboards and KPIs.
Yes. The KPI result operation returns a calculation result that your application can present in its own interface, with the measure’s meaning, unit and reporting period.
API resource and result operations are separate from supported embedded dashboard viewing. The API can support reporting setup or return a KPI result; interactive dashboard viewing is a distinct integration task.
Your developers build the integration workflow and configure the required user context, reporting permissions and underlying data access. Canvas preparation is one part of that setup, alongside access and data configuration.
IntelliFront BI is self-hosted on your organization’s infrastructure. Your team operates the platform and maintains the reporting, while your developers connect the documented API capabilities to your application.
Show Us the Reporting Experience You Want to Build
Book a demo around one onboarding workflow: the reporting a new reader needs, their personal Canvas and the place they should begin. See how IntelliFront BI could connect that experience to your application.
Ready to explore with your developers? Start a 30-day trial and assess a representative setup workflow and KPI result on your own infrastructure.