

Self-hosted operational screens and KPI wallboards

Keep Your Team’s Workload and Targets in View

Give the whole team a shared view of performance.

IntelliFront BI

Bring outstanding work, progress and service targets together on an operational screen. IntelliFront BI from ChristianSteven Software helps you build native dashboards and KPIs for the measures your team follows, on infrastructure your organization controls.
Download the IntelliFront BI Internal Evaluation Guide START FREE TRIAL
  • See outstanding deliveries beside the team’s agreed targets.
  • Keep labels and visual cues clear at the viewing distance.
  • Let supervisors investigate the detail in their own workspace.
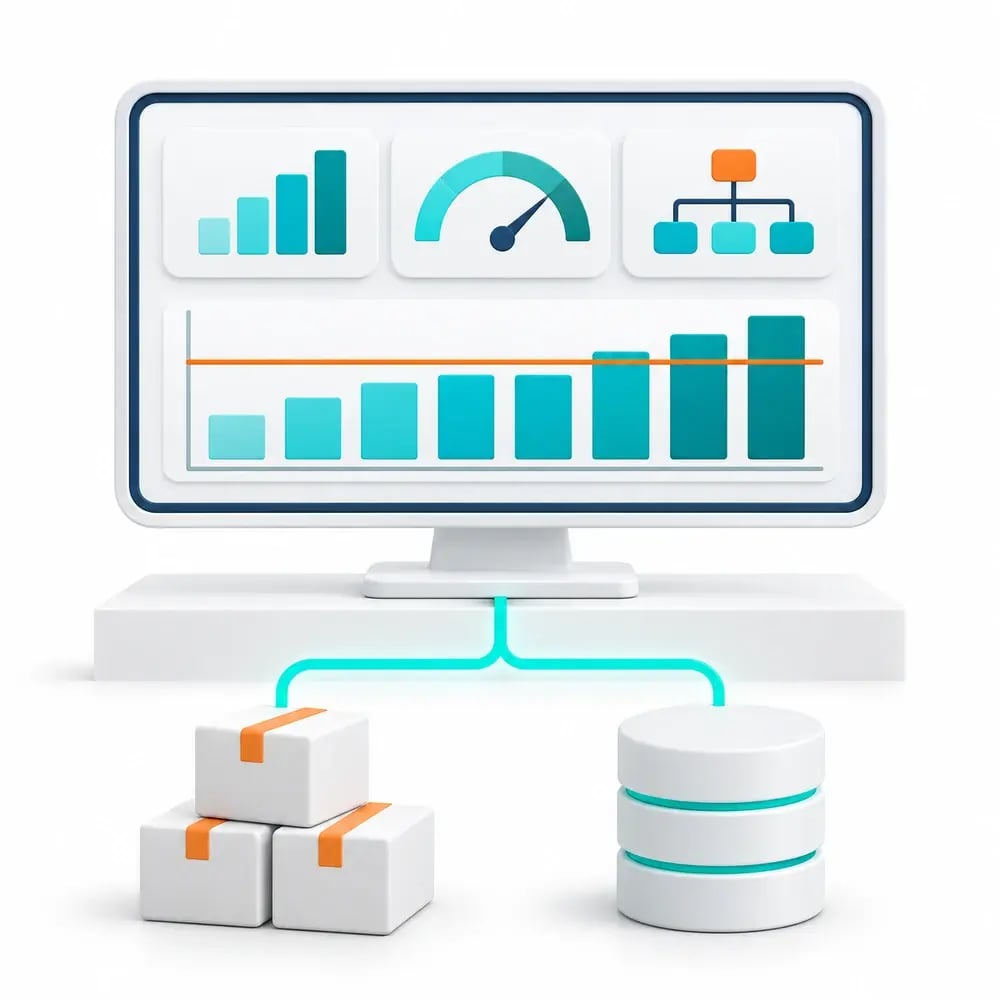
Concept illustration of an operational reporting display connected to delivery and business data

Give every shift the same picture of the work

How much work is still outstanding? Is the team keeping pace with its service target? When those answers are buried in separate reports, the handover starts with finding the figures.

A focused operational screen puts the agreed measures in view. IntelliFront BI dashboards and KPIs give the team a shared starting point for discussing progress and where attention is needed.

“We are also producing real-time data which assists our Projects team in the management of their projects.”
Ruth G. · Barnabas Aid
On project reporting
Customer example; freshness depends on the source and refresh configuration.

Make the gap between workload and target easier to see

An outstanding delivery count is more useful when the team can see how it compares with the agreed target. A clear label, target line and unit help turn the number into a meaningful conversation.

Build a focused view of the workload and service measures that matter during the shift. Consistent number formats, shapes and line styles help distinguish results without relying on colour alone.

Keep the team overview visible while supervisors look closer

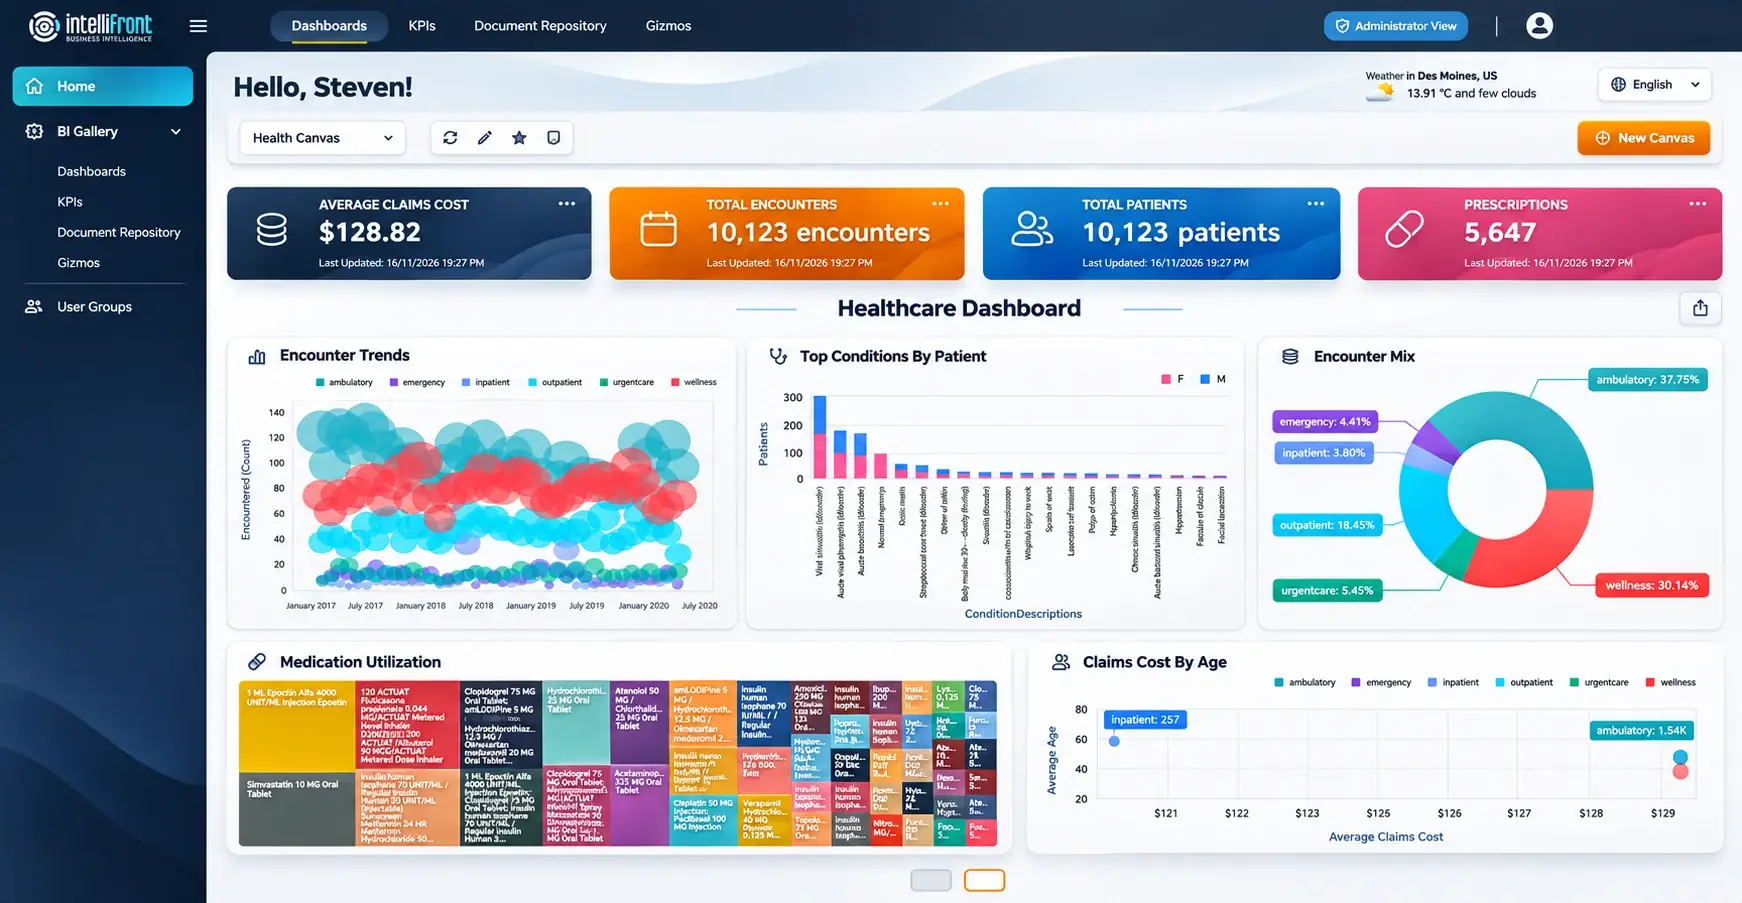
The shared screen answers the questions everyone needs during the shift. A supervisor can investigate the detail at a desk, using a personal Canvas of assigned dashboards and KPIs.

Bring the headline measures together for the team, then give the supervisor a focused workspace for the location, period or result that needs attention.

Enhanced healthcare Canvas illustration showing a personal workspace. Your shared display can use a simpler view suited to its audience and viewing distance.

View the complete Canvas at full size →

See how your team’s overview and follow-up could work together. Bring your shift measures to a demo, or explore them in a 30-day trial.
BOOK A DEMOSTART FREE TRIAL

Give the numbers the context your team needs

Outstanding work now and performance over a completed shift are different questions. Clear definitions and reporting periods help the team understand which result it is looking at.

IntelliFront BI lets your reporting team shape the dashboards and KPIs around those questions. Source and update information help readers judge whether a view is current enough for the task.

Explore a screen built around your operation. Bring a few agreed measures to a demo, or start a 30-day trial with representative reporting.
BOOK A DEMOSTART FREE TRIAL
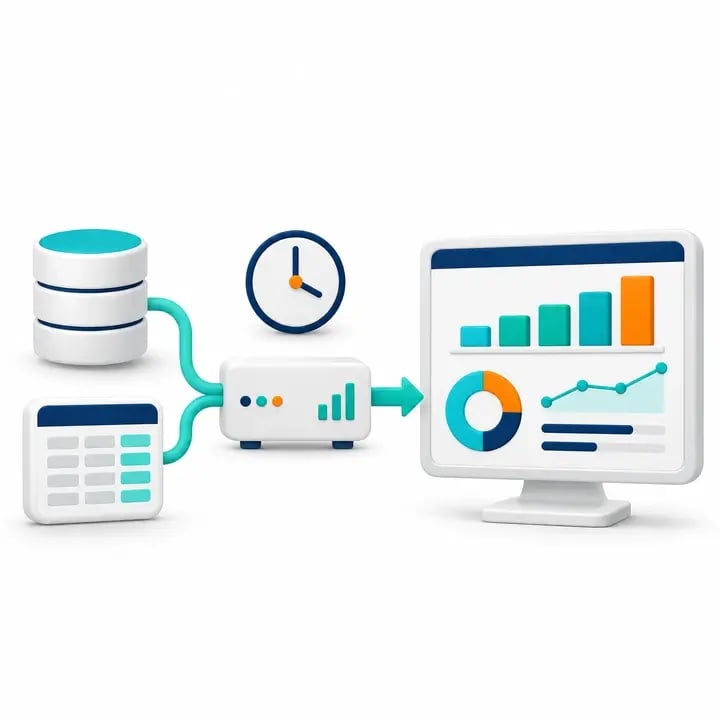
Concept illustration of the path from source data through reporting to a refreshed operational display

Your operational reporting, on infrastructure you control

IntelliFront BI is self-hosted. Your organization runs the platform, maintains the dashboards and manages access to the browser view used on the screen.

Your team chooses reporting suitable for everyone who can see the display, with permissions and data restrictions configured for that audience.
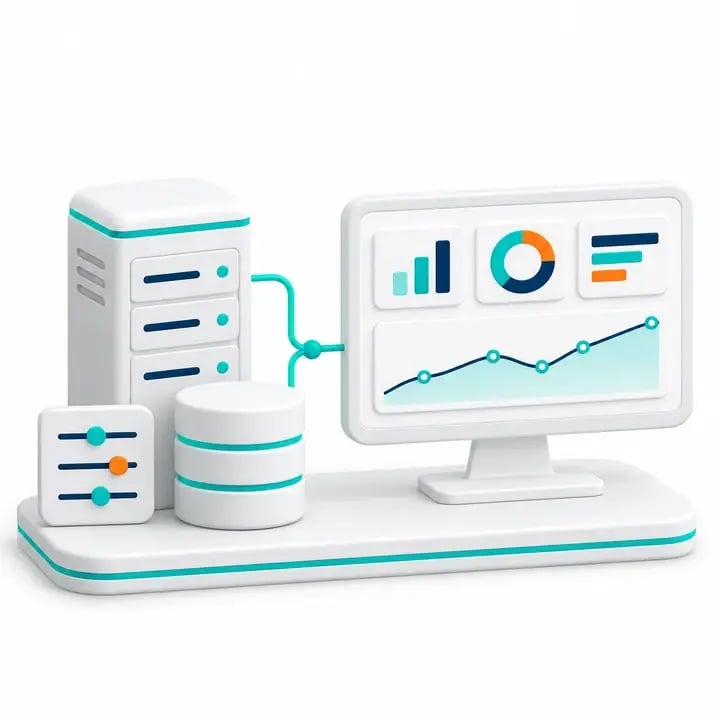
Concept illustration of organization-controlled reporting infrastructure connected to an operational screen

Carry the same meaning into the next handover

The next shift needs a consistent understanding of outstanding work, completed deliveries and service targets. Centrally maintained KPI definitions give those discussions a common basis.

As priorities change, your reporting team can adapt the view while keeping labels, targets and guidance clear. The display remains tied to the operating questions the team needs to follow.

Business Intelligence Backed by More Than 20 Years of Experience

ChristianSteven Software has helped nearly 5,000 organizations in 47 countries with business intelligence and reporting automation. IntelliFront BI brings that experience to your operational reporting, with native dashboards and KPIs, personal supervisor workspaces and support for the team maintaining the service.

20+
Years of business intelligence and reporting experience
Nearly 5,000
Organizations helped worldwide
47
Countries with customer organizations
SOC 2 Type II
Independent assurance over security and operational controls
Visit Our Trust Center →
Technical Support
Support and maintenance included with your IntelliFront BI subscription
All Features
Full IntelliFront BI functionality for dashboards, KPIs, Canvases and reporting
Before you evaluate

Questions about operational screens and KPI wallboards

What should we put on a KPI wallboard?

Choose a small set of workload or service measures the team follows during the shift. Give each one a clear label, unit, target and reporting period. Detailed tables are better suited to a supervisor’s follow-up view.

Will every display configuration update automatically?

Update behaviour depends on the source refresh, cached reporting data and the browser view. A source update does not by itself confirm that the screen shows the latest result. Check the required update interval in the chosen display configuration.

Can we leave the browser view running unattended?

Session behaviour depends on the access and browser arrangements used for the screen. Check sign-in expiry, reconnection and recovery on the actual display before relying on it for unattended use.

How can a supervisor investigate an exception?

The supervisor can open assigned dashboards and KPIs in a personal Canvas and explore the supporting reporting at their desk. The shared screen can stay focused on the team overview while the supervisor investigates the detail.

How do we make the view readable across a room?

Use a small number of measures with clear labels and suitable number formats. Shapes and line styles can support colour in distinguishing results and targets. Assess the finished view at the screen’s actual size and intended viewing distance.

Who can see the information on the screen?

Reporting permissions and data restrictions govern the browser view opened for the display. Everyone with a physical view of that screen can see what it shows, so choose content suitable for that audience.

Explore IntelliFront BI

See Your Team’s Workload and Targets Together

Book a demo around the measures your team follows during a shift. Explore a focused operational overview and the detail a supervisor needs when a result raises a question.

Prefer to evaluate it yourself? Start a 30-day trial and assess the reporting on your intended screen, with your operations and IT teams.

BOOK A DEMO START FREE TRIAL