

Self-hosted reporting for software customers

Make Reporting Part of Your Software Offering

Reuse the design. Make it useful for each customer.

IntelliFront BI

Give customers a branded reporting experience your team can adapt as your software service grows. IntelliFront BI from ChristianSteven Software combines native dashboards, KPIs and personal Canvases in a self-hosted platform, with supported API operations and embedded dashboard viewing.
Download the IntelliFront BI Internal Evaluation Guide START FREE TRIAL
  • Make customer reporting a recognizable part of your software service.
  • Let readers choose assigned dashboards and KPIs for personal Canvases.
  • Adapt reporting designs for the next customer.
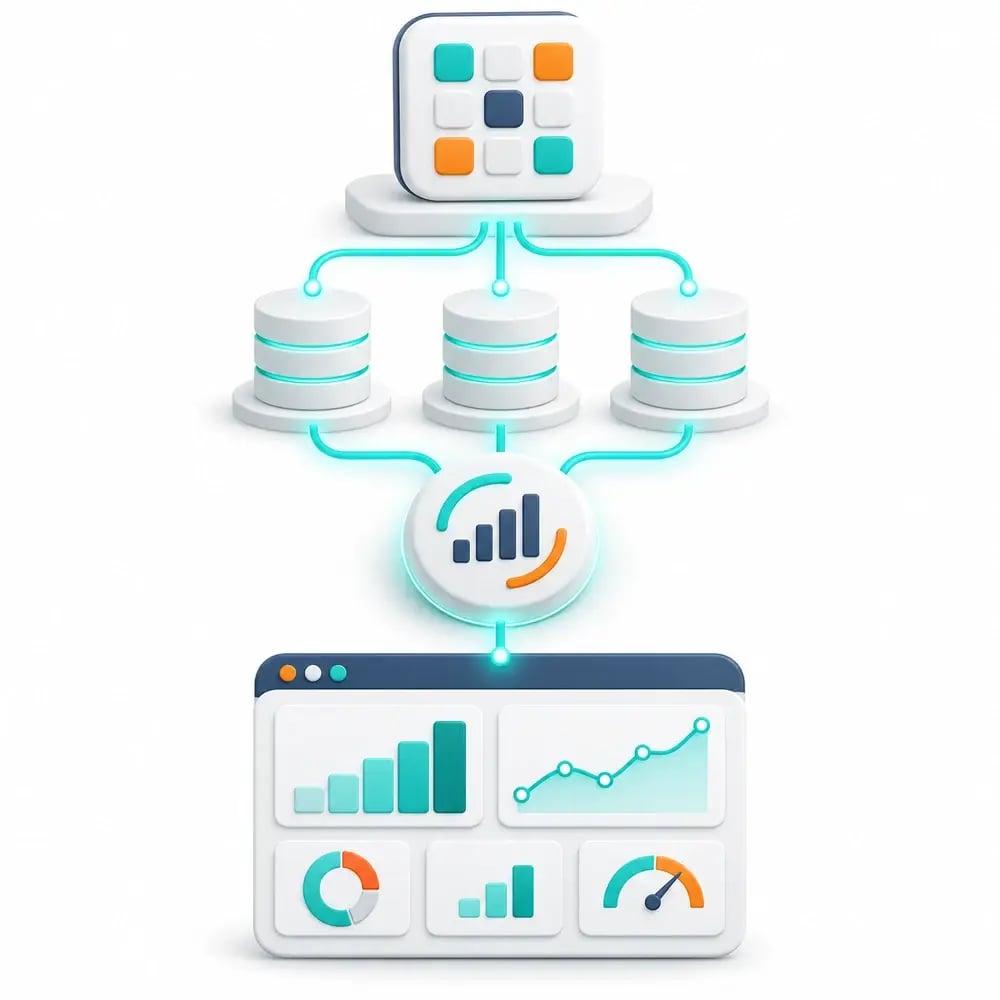
Concept illustration of application data becoming customer dashboards and performance measures

Turn recurring customer requests into a reporting offer

One customer wants activity by location. Another asks about outstanding work. Similar questions keep returning, and each new request takes time from your software team.

IntelliFront BI gives useful reporting work a longer life. Create a design your team can reuse, adapt it for each customer’s data and audience, and give readers somewhere to explore the answers themselves.

“Everyone in our company has been very impressed by what we are now able to produce, so impressed in fact, that we are using IntelliFront BI to provide user-friendly data from some of our other systems, in addition to the one for which this was originally purchased.”
Ruth G.
Barnabas Aid · On extending reporting to other systems

Help customers get more from the software they chose

A warehouse customer can see how stock moves through locations, then use supporting reports to understand an unexpected result. The reporting turns data already held in your service into something their managers can use.

Clear measures, available filters and guidance give readers a reason to return. Your software team gains a reporting offer it can develop as similar requests emerge across its customer base.

Give each customer a useful reporting home

A warehouse manager might follow stock movement; a regional manager might compare locations. Personal Canvases let each reader keep the dashboards and KPIs assigned to them in a view they can return to.

Readers can create several Canvases and choose a favourite home view. Your team maintains the reporting, customer data and permissions behind the experience.

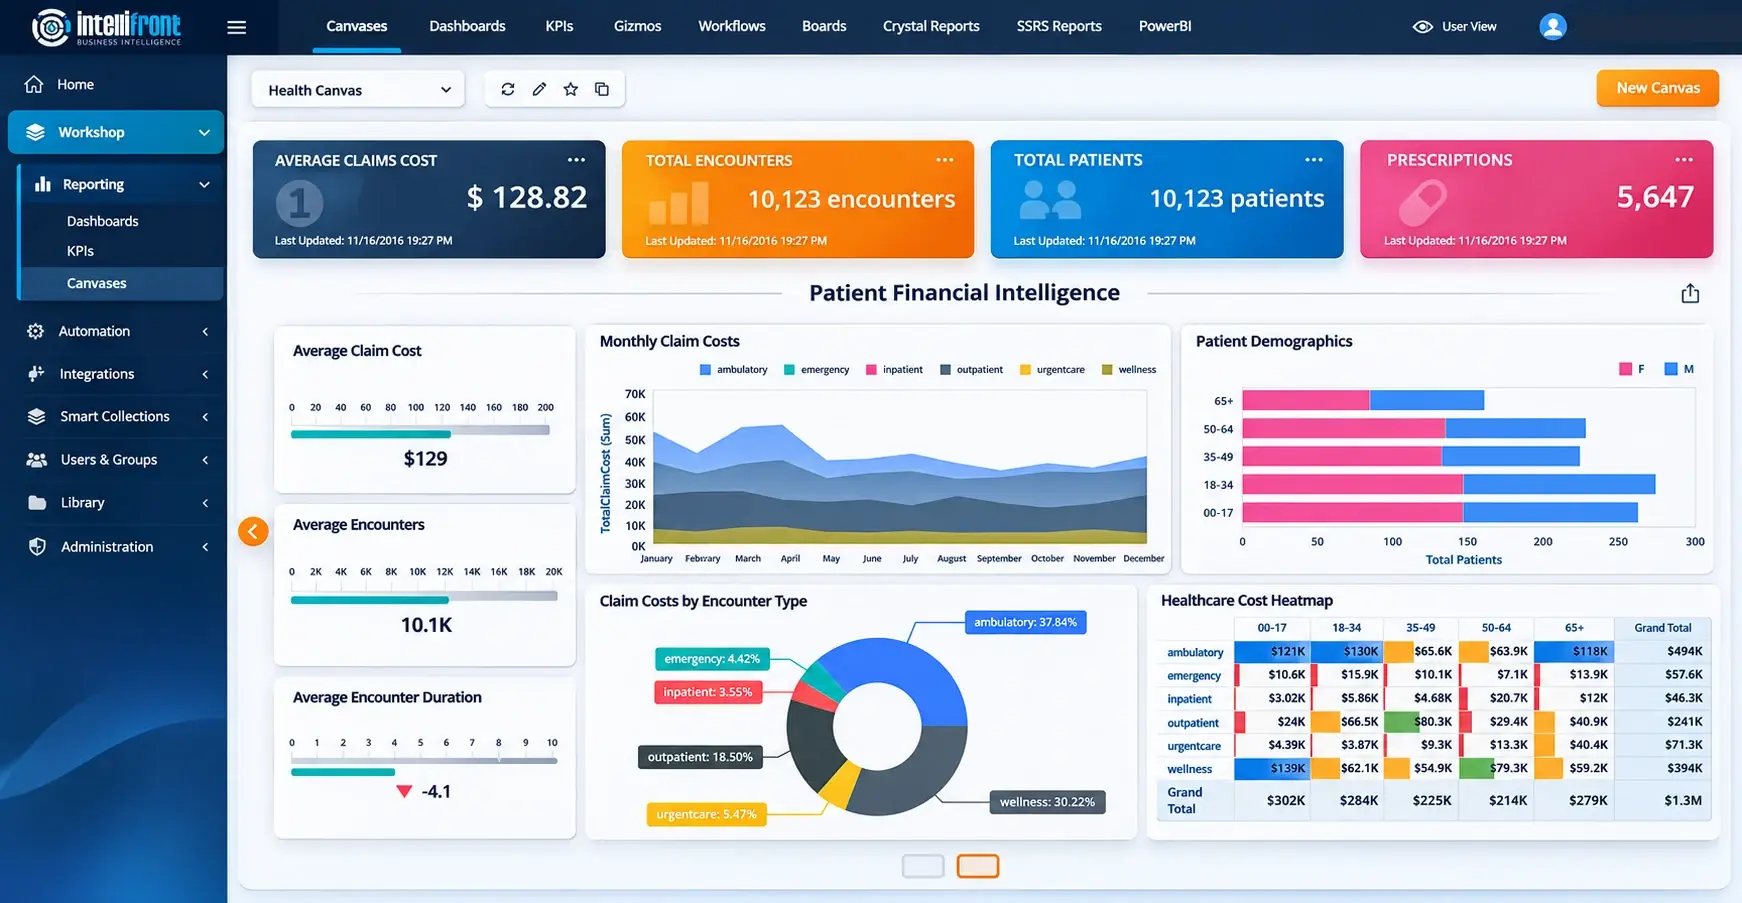
Enhanced Canvas illustration showing a healthcare financial example. Click the image or view the full Canvas.

See the reader experience your software could offer. Bring a recurring customer request to a demo, or explore the reporting workspace in a 30-day trial.
BOOK A DEMOSTART FREE TRIAL

Make the next customer rollout build on the last

Develop a reporting package around a recurring request: the dashboard design, calculations, formatting and guidance your team wants to maintain. Reuse the dashboard definition rather than rebuilding its layout for every customer.

For the next customer, your authors connect the design to that customer’s prepared dataset and check the measures against its data. Your team also configures the intended readers, content permissions and underlying data restrictions.

The design gives your team a starting point for a repeatable reporting service, with customer-specific setup kept under your control.

Explore the first rollout and the next. Book a demo around one reporting request, or try the design with representative customer data.

BOOK A DEMOSTART FREE TRIAL
Concept illustration of customer reporting with filters and related views

Your software brand. Your reporting platform.

White labeling presents the reporting service under your brand. Customer group and workspace branding help readers recognize the organization, account or project they are reviewing.

Your software business hosts and operates IntelliFront BI and maintains the reporting it supplies. Your team manages customer data restrictions, content permissions and user access behind that experience.
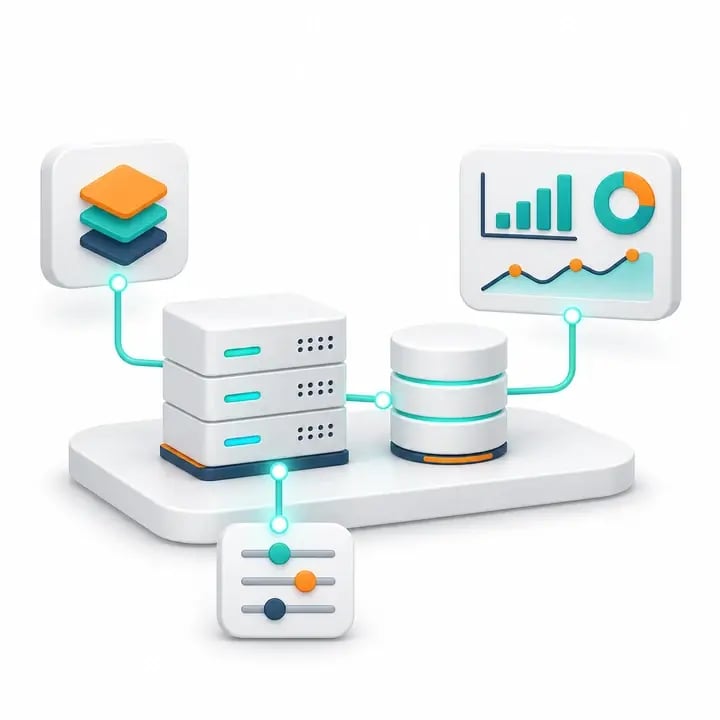
Concept illustration of self-hosted application and reporting infrastructure under organizational control

Fit reporting into the customer experience you are building

Where a dashboard belongs inside your application, embedded dashboard viewing provides another route for customers to reach it.

Supported API operations for Canvases and reporting resources can also become part of your developers’ onboarding workflow. Your team supplies the data mapping, user context and access configuration that make the reporting appropriate for each audience.

Explore the portal, embedded viewing and setup requirements together in a demo with your product and development teams.

Business Intelligence Backed by More Than 20 Years of Experience

ChristianSteven Software has helped nearly 5,000 organizations in 47 countries with business intelligence and reporting automation. IntelliFront BI brings that experience to your software reporting offer, with native analytics, personal reader workspaces and support for the team developing the customer experience.

20+
Years of business intelligence and reporting experience
Nearly 5,000
Organizations helped worldwide
47
Countries with customer organizations
SOC 2 Type II
Independent assurance over security and operational controls
Visit Our Trust Center →
Technical Support
Support and maintenance included with your IntelliFront BI subscription
All Features
Full IntelliFront BI functionality for dashboards, KPIs, Canvases and reporting
Before you evaluate

Questions about reporting for software customers

Can we reuse reporting designs for different software customers?

Yes. Your team can reuse reporting definitions, calculations, formatting and guidance, then adapt data connections, record references and permissions for each customer. Reusing a design does not replace the data and access configuration required for that audience.

How do we control what each customer can access?

During customer setup, your team configures the data connections and restrictions, user access and reporting permissions for that audience. Readers can select only assigned dashboards and KPIs for their Canvases. Reusing content or applying customer branding does not automatically configure data isolation.

Can the reporting carry our software service’s branding?

Yes. White labeling presents the reporting service under your brand. Customer group branding identifies the customer organization, and workspace branding can help readers recognize an account, project or contract.

Can we prepare customer workspaces through the API?

The API provides Canvas and supported reporting-resource operations. Your developers can combine them into a setup workflow using the appropriate user context, data mapping and access checks.

Can customers view a dashboard inside our application?

Embedded dashboard viewing provides a way to present a dashboard within your application. Your team configures the integration and manages the reporting, user access and hosting arrangements.

Where does the customer reporting platform run?

IntelliFront BI is self-hosted business intelligence software. Your organization hosts and operates the reporting platform, maintains the content and manages customer access.

Explore IntelliFront BI

See Reporting as Part of Your Software Service

Book a demo around a reporting request your customers keep making. Explore the reader’s experience, the design your team could reuse and the setup needed for each customer.

Prefer to evaluate it yourself? Start a 30-day trial and bring your product, reporting and development teams together around a representative customer use case.

BOOK A DEMO START FREE TRIAL