

BUSINESS INTELLIGENCE QUESTIONS

How Do You Choose Self-Hosted Business Dashboard Software?

At the daily service review, a manager can see the number of open requests. To decide where to move staff, they also need to know which team owns the oldest work.

Ask two managers to use the same dashboard on their usual screens. Watch where they hesitate, misread a number, or need to ask an analyst for help.

  
THE DAILY DECISION

Start with what the reader needs to decide

Choose self-hosted business dashboard software by testing one decision with the people who make it. For a service desk, the manager needs to see whether older requests are concentrated in one queue and whether someone can pick them up today.

Start with open requests by team, grouped by time since each request opened. Agree what counts as open and how reassigned or reopened requests should appear. Give the manager enough detail to decide where to move staff during the review.

Name the decision

Ask what the manager will do differently once they see the backlog.

  
CHARTS, FILTERS AND DETAIL

Follow a number to the work behind it

In the pilot, filter to Support and select the bar for requests open six days or more. The chart shows four requests. The supporting table should show the same four, with their request IDs, ages and queues. The example puts the chart and the table together so the reader can see what changed.
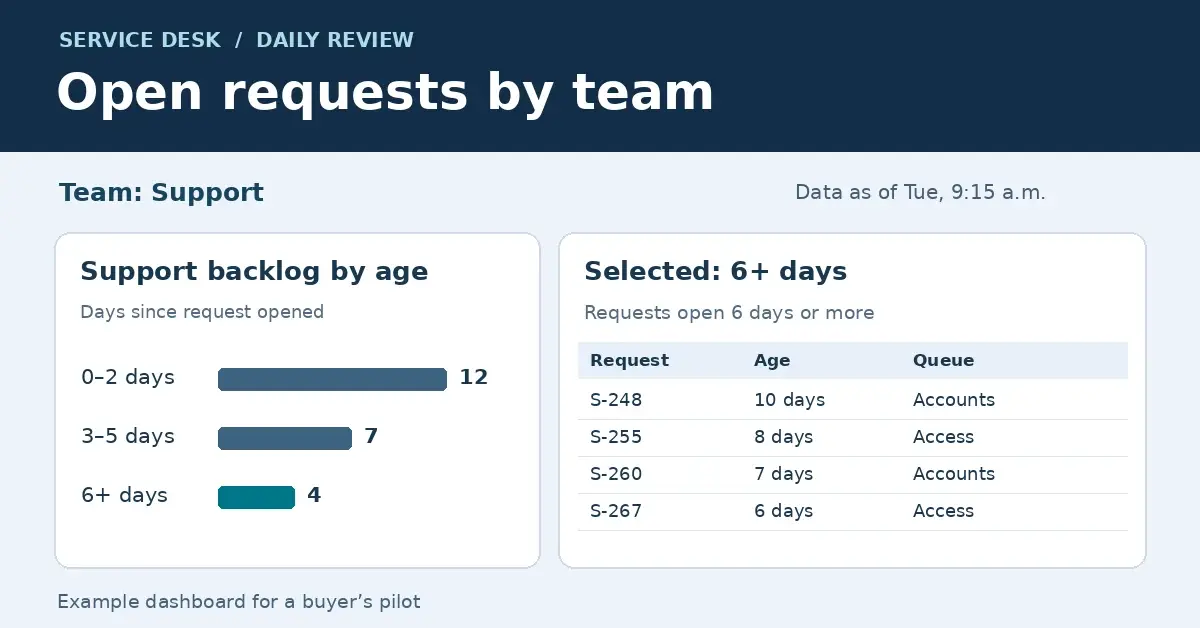
Example service dashboard filtered to Support. Selecting the six-days-or-more bar shows the four matching requests, their ages, and their queues.
The selected age band narrows the request list to four records. Open the full-size dashboard example.

Switch teams, then clear the selection. Check that the chart and table show the same scope at each step and that the reader can tell what’s selected.

Match the count

The detail should show four requests when the selected bar shows four.

  
BUILD AND UPDATE

Give an author a real change to make

Give the author the source they would use after rollout. Ask them to build the age chart and the request table, then change the age bands when the service manager says three days is too late to wait for a first review.

Check the totals after the change and see whether another author can take over with the saved data definitions. If the request history contains multiple updates per request, make sure those updates don’t inflate the backlog.

Hand over one change

Ask a second author to update the dashboard using the existing definitions.

  
DATA FRESHNESS AND ACCESS

Test what readers see on a normal day

Show when the dashboard’s data was last refreshed. Test what readers see when the source is late, and agree when the service desk needs a separate alert for work that can’t wait until the daily review. Choose the longest delay the team can accept before it needs to check the source directly.

Have managers open the dashboard on the screens they use for work. Check the filters and detail with an ordinary reader account and confirm that a saved link respects that account’s access.

Make data age visible

Readers should be able to spot a late refresh during the review.

  
THE SOFTWARE DECISION

Use the pilot to compare your options

Score each tool on whether the manager can find the oldest requests, tell how current the data is and act on what they see. Include the time it takes an author to make a change and check the result.

IntelliFront BI includes native dashboard authoring and supports filtering between dashboard items. Try those features with one service dashboard. See how your team can create and share reports and dashboards for that review. If managers also need related reports on the same screen, evaluate Canvas for that combined view.

Download the IntelliFront BI Internal Evaluation Guide

Contributors:

Christian Ofori-Boateng

Christian Ofori-Boateng

CEO, ChristianSteven Software