

LEARN BUSINESS INTELLIGENCE

Combining Business Data into One Useful Dashboard

Bring support tickets and customer targets into one dashboard. Match them by customer and month, keep tickets visible when targets are missing, and check that the join leaves the ticket count intact.

  
THE QUESTION

Which customers need a closer look?

When you’re combining business data from different sources, match support tickets to targets by customer ID and reporting month. Check that every ticket still appears once, and keep tickets with no matching target visible. You can then compare actual replies with the agreed targets.

For this example, a support lead is preparing October’s review from a ticket report and a customer-target spreadsheet. A spreadsheet can handle a one-off review. If your existing reporting tool can save this join and repeat the checks each month, start there.

Start with one month

Pick a period the team knows well. It’s easier to spot a surprising number when people remember the tickets behind it.

  
THE SOURCE RECORDS

Agree on what each row means

Use one row per ticket. This example covers first replies sent in October 2026 where a reply deadline is recorded. A reply sent by that deadline counts as on time. Unanswered tickets and missing deadlines need a separate check; this measure doesn’t describe the whole support queue.

In the target sheet, keep one approved row per customer per month. Alder’s 90% target means at least 90% of its included tickets should receive their first reply on time. Use the same customer IDs and month format in both sources.

Match by customer ID

A company might appear as “Alder Ltd” in one file and “Alder” in another. Use the same ID in both sources.

  
THE JOIN

Keep tickets when a target is missing

Keep every ticket row and add the target where the customer ID and month match. That’s a left join, with tickets on the left. Cedar has one ticket and no October target. Its reply still counts; show No target rather than treating the missing target as zero.

Check the target sheet for repeated customer-and-month pairs first. Two October rows for Alder would match each of its three tickets twice. Ask the sheet’s owner to confirm one approved target before using the joined result.

Keep the review repeatable

Agree who updates each source. Save the ticket cutoff and the approved target-sheet version with the monthly review so you can reproduce its figures.

  
THE CHECK

Count the tickets before and after the join

In this small October example, start with six tickets and five on-time replies. After joining the approved targets, you should still have six rows, with each ticket ID appearing once. A duplicate October target for Alder would produce nine rows.

Check the six ticket records
October 2026 · one row per ticket
TicketCustomer ID and nameFirst reply
T01C01 · AlderOn time
T02C01 · AlderOn time
T03C01 · AlderLate
T04C02 · BirchOn time
T05C02 · BirchOn time
T06C03 · CedarOn time

Alder has two on-time replies out of three: 66.7%. Birch has two out of two: 100%. Cedar has one out of one: 100%, with no target to compare it against. Together, that’s five out of six, or 83.3%. Calculate from the ticket counts; averaging the three customer percentages would give a different answer.

Compare like with like

If the totals differ, check that the ticket report and the dashboard both use the first reply date to pick the month.

  
THE DASHBOARD

Read the result and decide what to check next

If several people need the same view, IntelliFront BI is self-hosted business intelligence software from ChristianSteven Software. Your organization runs it on its own infrastructure. Here, it presents the checked data as a dashboard with each customer’s reply rate beside its target.

Alder’s 66.7% falls below its 90% target. Birch’s 100% meets its 95% target. Cedar remains visible as No target, so its on-time reply doesn’t hide the missing target.
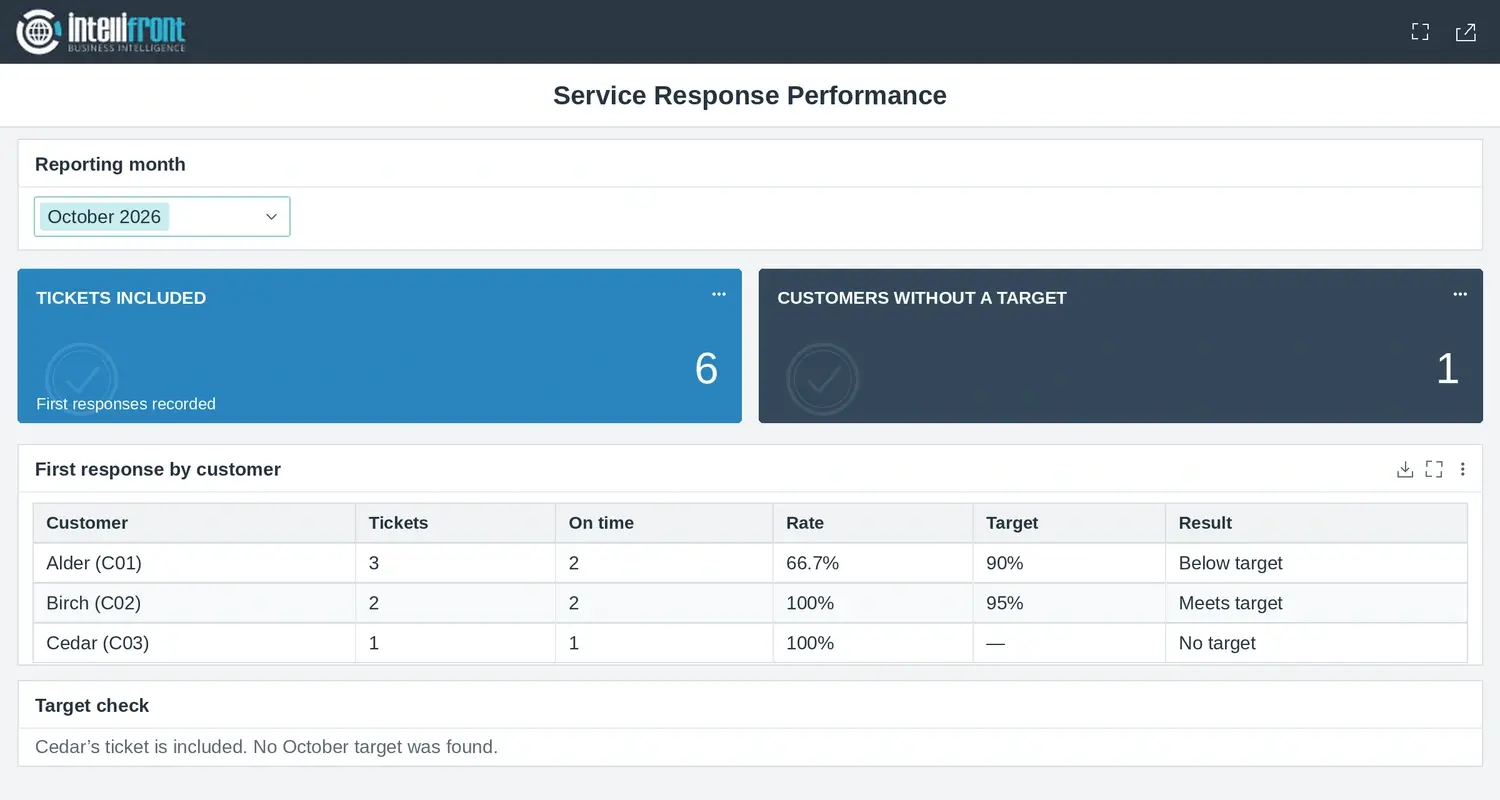
Service response dashboard for October 2026. Five of six tickets were answered on time. Alder missed its target, Birch met its target and Cedar had no target.
October’s first replies and customer targets in one view. Open the full dashboard.

The support lead now has two different follow-ups: investigate Alder’s late ticket, T03, in the support system and ask the target-sheet owner to confirm Cedar’s October target. All six tickets remain in the review. Missing target data has become a visible task rather than a missing customer.

If your team needs to review these figures every month, see how to create a shared dashboard from your reporting data.

Contributors:

Christian Ofori-Boateng

Christian Ofori-Boateng

CEO, ChristianSteven Software