

LEARN BUSINESS INTELLIGENCE

Keeping Operational Dashboards Current

Agree how old the data can be before someone risks acting on the wrong status. Then time one real change from the source to the dashboard and show readers how far the data goes.

  
START WITH THE DECISION

Decide How Current the Dashboard Needs to Be

A service desk uses a dashboard to find tickets waiting for an owner. It can act on information up to ten minutes old. Agree that window with the people using the dashboard, then decide who will investigate if an update falls behind.

If your team only needs a daily snapshot, give it a clear date and time. A queue used throughout the day needs a shorter update window.

Start with the decision

Ask how long someone can wait before an old status starts causing extra work.

  
UNDERSTAND THE JOURNEY

What happens between a source change and the screen?

Follow a ticket assignment from the service desk system to the screen.

  • The service desk system saves the new assignment.
  • The dashboard fetches the data, either from the service desk system or from a copy set aside for reporting. It may keep using the last data it fetched until it checks again.
  • The screen updates and shows the new assignment.

Refreshing the browser can redraw the view while the dataset still holds older data.

Name the three times

Keep source update, data collection and screen refresh distinct when you investigate a delay.

  
COORDINATE THE UPDATES

Set Data Retrieval and Display Refresh Together

Allow time for each step, including any reporting copy. For a ten-minute target, the service desk might allow two minutes for the change to reach the reporting source, up to five for collection and up to two for the screen to redraw. That leaves about one minute of margin in this example.

Try the refresh controls in your current system first. If the team also needs a shared place to build and read dashboards, IntelliFront BI is ChristianSteven Software’s self-hosted reporting platform. You run it on infrastructure you manage. The dataset setup guide covers how its caching controls affect when the dashboard retrieves data.

Check the slowest stage first

A faster screen refresh cannot make a slow source extract arrive sooner.

  
TEST A REAL CHANGE

Trace One Record All the Way to the Reader

Say you save a test ticket, TEST-104, as awaiting assignment at 09:02. The dashboard picks it up by 09:06 and shows it at 09:07. That’s five minutes from saving the ticket to seeing it on screen, within the desk’s ten-minute limit.

Assign the same ticket and check that it leaves the queue. If it stays there, compare the source, reporting copy and dashboard data until you find the first place that still shows the old status.

Test the change both ways

Check that the ticket appears when it needs work and leaves the queue when someone takes it.

  
HELP READERS TRUST THE VIEW

Show readers how far the data goes

Now try a different run with an older export. The dashboard collects the file at 09:06 and redraws at 09:07, but the file only includes changes through 09:00. Label the view “Source data through 09:00.” If the data falls outside the team’s ten-minute limit, show a notice and tell readers where they can check the current ticket status.
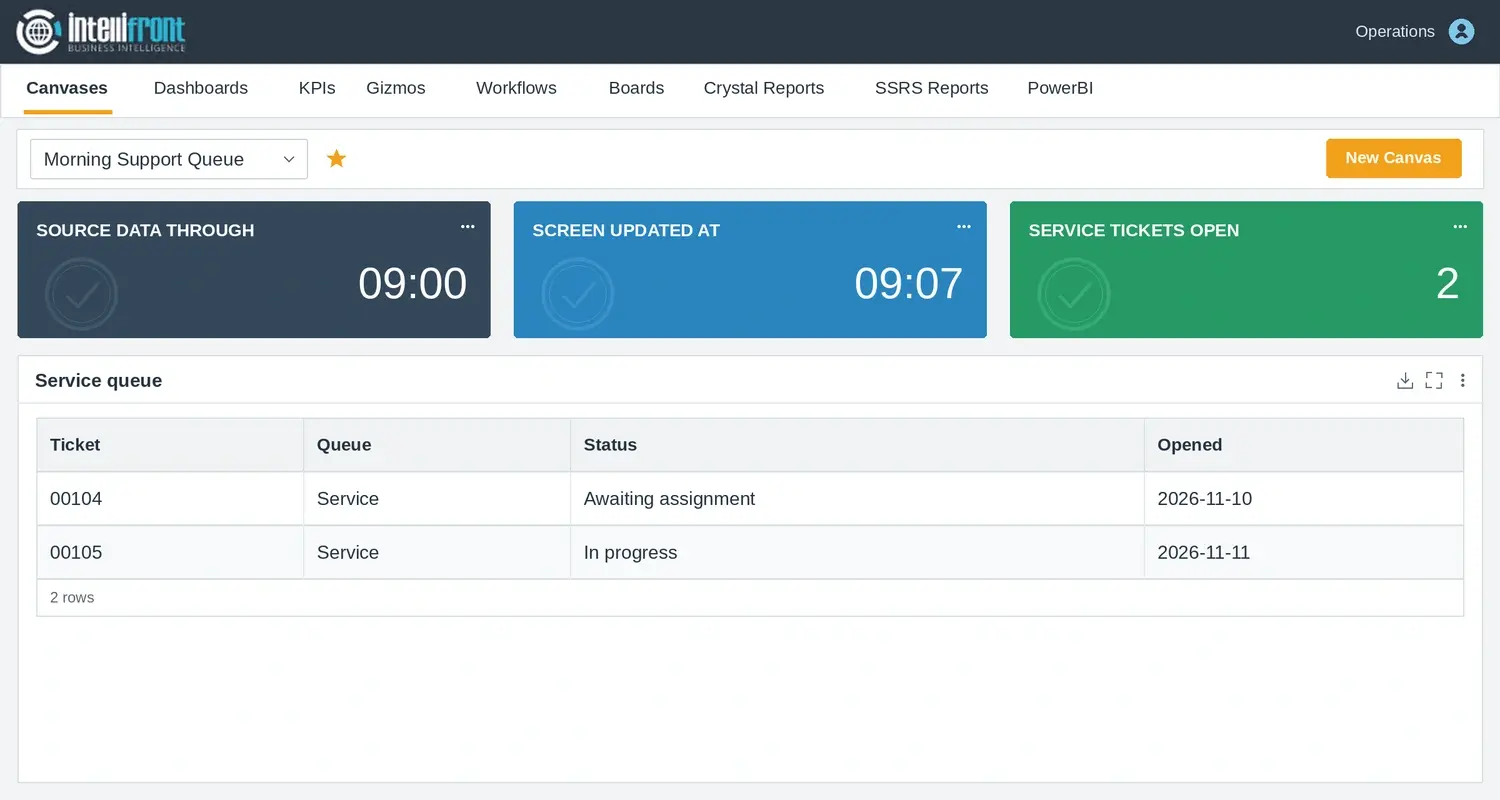
Morning Support Queue Canvas showing source data through 09:00 and the screen updated at 09:07.
The screen redrew at 09:07. A ticket entered after 09:00 won’t appear in this run. Open the full image.

When you need to investigate a delay, the IntelliFront BI refresh history guide explains how to read the processing timestamps. Begin with the queue your team checks most often. If it also needs a shared place to work from, explore operational dashboards for a shared queue view.

Contributors:

Christian Ofori-Boateng

Christian Ofori-Boateng

CEO, ChristianSteven Software