

LEARN BUSINESS INTELLIGENCE

Mapping Projects, Supporters and Regional Performance

Use a point map to show where projects are and a shaded map to compare giving rates. Put the counts beside both views. A region can have more people giving and still have a lower giving rate.

  
CHOOSE THE GEOGRAPHIC QUESTION

Decide What the Map Should Explain

A charity preparing its quarterly review has two questions. Where are its active projects? What share of its existing supporters gave in each region?

  • Count projects that are active at quarter-end. Give each project one primary region for reporting.
  • For participation, start with supporters in scope at the beginning of the quarter. Count each person who made a qualifying gift once. Report new supporters separately.

Choose the view by question

  • Individual places need a point map.
  • Regional rates need a shaded map.
  • Readers need a table to check both.
  
MATCH THE VIEW TO THE MEASURE

Why can more people give in a region with a lower rate?

Divide the number of supporters who gave by the number in scope, then multiply by 100. In North Coast, 240 of 1,000 supporters gave, or 24%. Central Valley had half as many people give, but they made up 30% of its 400 supporters. Which region leads depends on which question you’re asking.

Three regions from a wider fictional quarterly review
RegionActive projectsSupporters in scopeSupporters who gaveParticipation rate
North Coast121,00024024%
Central Valley640012030%
South Hills46006010%

When two regions are selected, add the counts first. North Coast and Central Valley have 360 supporters who gave out of 1,400 in scope, or 25.7%.
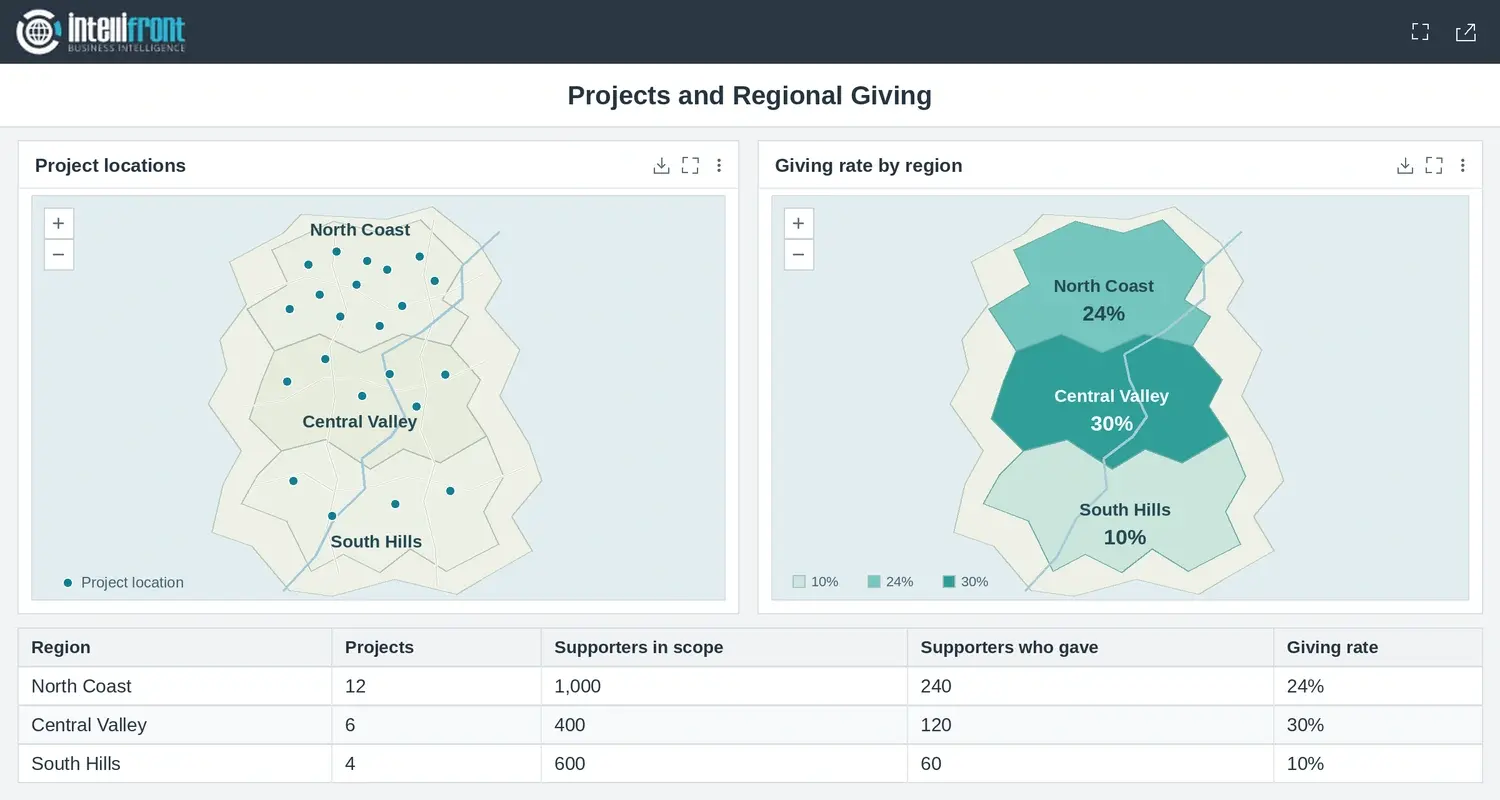

Project locations and regional giving rates shown side by side. North Coast has a 24% giving rate and Central Valley has 30%.
North Coast had more people give. Central Valley is shaded darker because a larger share of its supporters gave. Open the full image.

Label the number clearly

Use “Share of existing supporters who gave” and show the quarter. Put the two counts beside the rate.

  
PREPARE THE LOCATION DATA

Match Every Record to the Right Region

Give each region a stable code. Use it to match each project and supporter to the right boundary. Count the projects and supporters separately before bringing the totals together. A region with 12 projects still has one supporter total.

  • Check project coordinates against known sites.
  • Keep unmatched records under “Unassigned region.”
  • Compare the regional totals with the source total before sharing.

Keep an eye on boundaries

Record the boundary version with the quarterly review. A change in boundaries can change a comparison even when the source records stay the same.

  
BUILD A SHARED READER VIEW

Bring the Map and Its Evidence Together

Use your existing mapping tool if readers can already compare the regions and see the counts. A shared dashboard helps when the map, table and supporting detail need to stay together.

In IntelliFront BI, you can use project coordinates for the point map and regional boundaries for the shaded view. It’s ChristianSteven Software’s reporting platform, hosted on infrastructure you manage. The guide to shaded regional maps shows how to set up the regional view.

Try one click

Ask a reader to select Central Valley and explain the 30% using the two counts in the table.

  
CHECK THE COMPLETE PICTURE

Reconcile the Regions Before Sharing

Check the example before expanding it. The three named regions total 420 supporters who gave out of 2,000. Suppose the source also has ten supporters with no region assigned, and two of them gave. Keep those records in the overall figure, 422 of 2,010, or 21.0%. Leave the three named regions’ rates as they are and show the unmatched records in the table.

Start with one question you can check against the source. If your readers need to look at the map and the counts together, see how to create and share dashboards with supporting detail.

Contributors:

Christian Ofori-Boateng

Christian Ofori-Boateng

CEO, ChristianSteven Software