

LEARN BUSINESS INTELLIGENCE

Turning Report Data Into an Interactive Dashboard

Start with the rows behind the report. Keep each ticket’s ID and the queue and other fields people use to find their work, then check that one filter gives the same answer in the dashboard as in the original report.

  
START WITH THE READER

Choose the Question Your Report Already Helps Answer

The service desk lead opens the morning report to see which tickets her team needs to pick up. The report already has the answers. Check whether it can export one row for each of those tickets.

Keep the ticket ID, queue, status and opened date. The lead can use the queue to find her team’s tickets and the ID to open the right one.

Check the report first

If a filtered report or spreadsheet already lets the team find and act on its tickets, start there.

  
PREPARE THE ROWS

Turn the Export Into a Consistent Dataset

Use one header row and one row per ticket. Remove report headings and subtotals from the data file. Keep IDs as text so 00104 retains its leading zeros.

Fictional open-ticket export: three tickets across two queues
Ticket IDQueueStatusOpened date
00104ServiceAwaiting assignment2026-11-10
00105ServiceIn progress2026-11-11
00106BillingAwaiting assignment2026-11-12

If the export lists a ticket once per activity, keep one row per ticket. Use its queue and status as of the reporting cutoff, and keep its original opened date. For a snapshot, keep the same cutoff when you compare the dashboard with the source report. This sample should give you three tickets overall, two for Service and one for Billing.

Run a small check

  • Look for repeated ticket IDs.
  • Sort by opened date and check that the oldest ticket appears first.
  • Use the same queue names throughout.
  
BUILD THE READER VIEW

Let readers go from the total to the tickets

Build the ticket list first, with a queue filter and a count above it. In Queue filter, select Service. The count should say two, and the list should show 00104 and 00105. That gives the lead two tickets she can follow up on.

When the team needs a shared dashboard, IntelliFront BI can build one from the prepared export. It’s ChristianSteven Software’s reporting platform, hosted on infrastructure you manage. A queue selector lets the lead switch queues without leaving the dashboard.
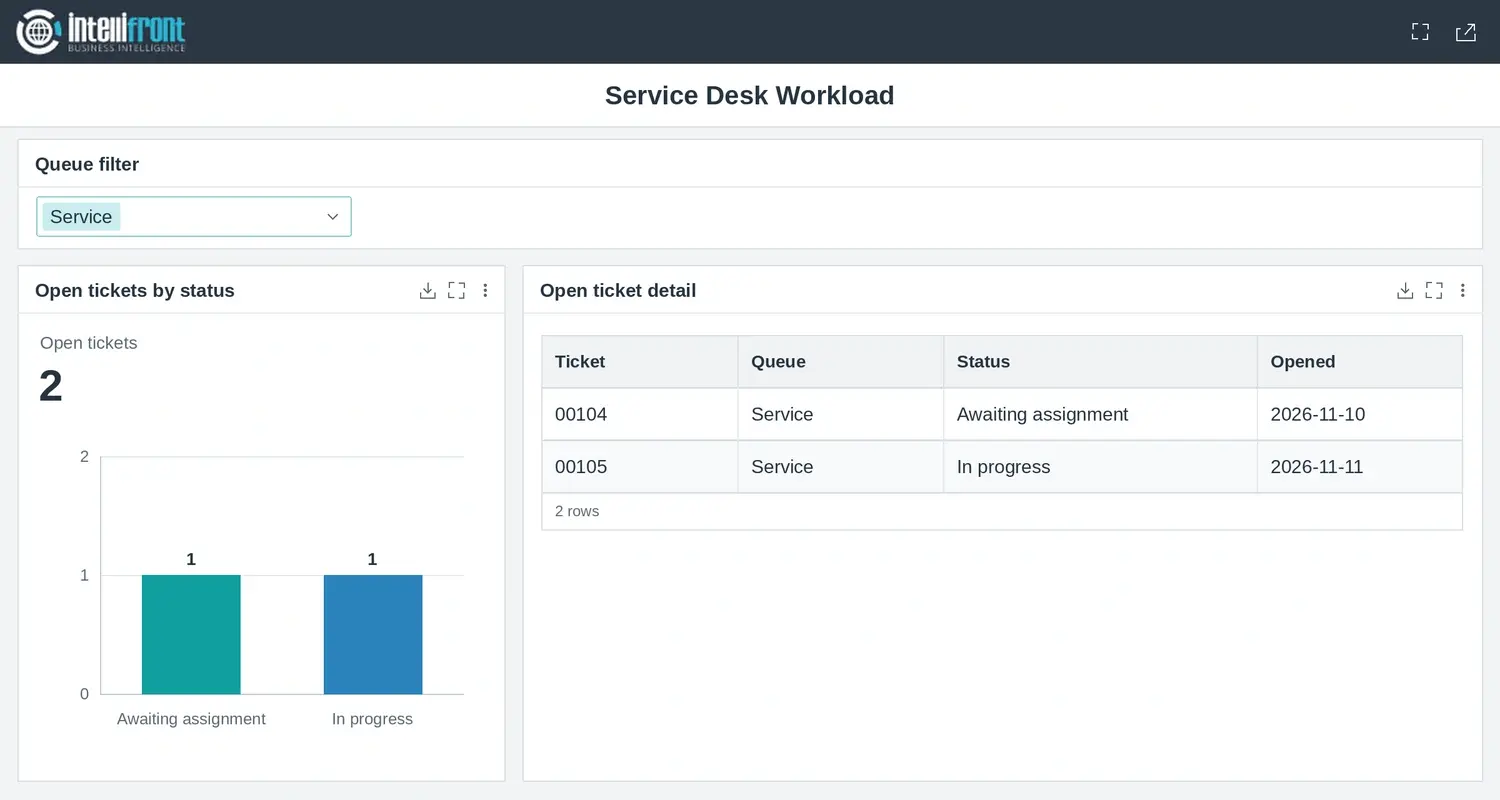

Service desk dashboard with the Service filter selected and tickets 00104 and 00105 listed.
The Service queue shows tickets 00104 and 00105. The Billing ticket stays out of both the list and the total. Open the full image.

Show the answer in both places

When a filter changes, check the total and the underlying rows together.

  
RETURN TO THE RECORD

Make Record Links Useful to the Reader

If the source system supports stable record links, let the ticket reference open the source record. Test the link using the reader’s account. Try an allowed record and a record that account should be unable to open.

Leave updates and assignments in the service desk system. Readers may see a newer status there if the dashboard uses a snapshot.

Keep the source in charge

A record link takes the reader to the work. The source system still controls what they can see and do.

  
KEEP THE VIEW USEFUL

Choose How the Dashboard Gets Its Next Update

A recurring file can work if a dated snapshot is enough. Replace the previous file once the new export has finished. If readers need more current results, consider a database query that preserves the report’s selection rules.

Close ticket 00104 in the test source and reload the dashboard. Service should drop from two tickets to one, while Billing stays at one. If the team needs a shared version of this view, see how to create and share an interactive dashboard.

Contributors:

Christian Ofori-Boateng

Christian Ofori-Boateng

CEO, ChristianSteven Software