

Using Stock and Ordering Data in Hospital Pharmacy
If the stock count finished where it started, look at what came in and what went out during the week. Then check the order dates. That can explain why the balance stayed steady and show which of the six orders are worth asking about.
Start With the Question Behind the Balance
At a stock review, the stores colleague sees that the paracetamol balance has barely moved. The procurement lead has the order list in front of them and can see the medicine came up again and again. How can both be true?
The two colleagues pick one item to follow: paracetamol 500 mg tablets in 100-tablet packs at Pharmacy Stores. In the worked example, they compare the opening and closing balances with the supplier orders, the goods the store received and the stock it issued. Each tells them a different part of what happened.
That choice of item, pack and location matters. A line for a 12-tablet pack belongs in a separate comparison. A request from the dispensary is also a different event from a supplier order placed by the store. Once those are clear, the dates show how the week unfolded.
A familiar item helps
Choose an item the stores and procurement team already know. Their knowledge gives the figures context and makes the first review easier to follow.
Follow One Pack Through the Week
The store opens the week with 1,000 containers. Each order in this example has one line for the selected item, and all movements use containers of that same pack size.
| Date | Activity in the records |
|---|---|
| Mon 2 Nov | Orders O101 and O102 are released at 09:00 and 14:00. Each requests 300 containers. |
| Tue 3 Nov | Receipt R201 records 600 containers against O101 and O102. The store issues 600 containers. |
| Wed 4 Nov | Orders O103 and O104 are released at 09:00 and 14:00. Each requests 300 containers. |
| Thu 5 Nov | Receipt R202 records 600 containers against O103 and O104. The store issues 600 containers. |
| Fri 6 Nov | Orders O105 and O106 are released at 09:00 and 14:00, each for 300 containers. Receipt R203 records 600 containers against them. The store issues 600 containers. |
How the balance stays steady
By Friday close, 1,800 containers have arrived and 1,800 have been issued. With no other movements or adjustments in the example, the balance is 1,000 + 1,800 − 1,800 = 1,000 containers.
The stores colleague now has an account of the movement behind the steady balance. Stock moved through the store, and colleagues raised six orders to bring in those 1,800 containers. The receipt references show how the requests were fulfilled.
For a real item, returns, transfers and adjustments may also contribute to the reconciliation. Following the movements recorded by your own pharmacy system helps you account for the opening and closing positions.
Traceable transactions
Order numbers, line identifiers and receipt references let colleagues follow a quantity from request to receipt. Keep those references available behind the totals.
See the Ordering Pattern in the Dates
The procurement lead looks at the release times. There are six distinct orders across three ordering days. Each day has a morning request and an afternoon request for the same item, five hours apart. The corresponding receipt brings the two quantities together.
That gives the team a useful description of the pattern: two releases on each ordering day, followed by one receipt for each pair. Counting the six order lines alone would have left the timing hidden.
What the team can investigate next
The question becomes, “What prompted the second release on each of those days?” The colleagues who raised the requests can explain whether a later requirement, an urgent need or the ordering routine produced it. Their answer will help the procurement lead assess whether any requests could share a release time.
Request timing is only part of that discussion. Demand, storage capacity and supplier arrangements also affect the choices available. Guidance from the UK’s National Health Service (NHS) Specialist Pharmacy Service identifies frequently ordered lines as a useful area for review in that wider context.
The reporting has already improved the discussion: everyone can point to the same orders, times and quantities. A change to the ordering routine would follow from understanding those requests, rather than from treating a high count as a problem by itself.
Your pharmacy system’s existing reports may provide everything needed for this review. When colleagues repeatedly spend meeting preparation time matching stock lists to transaction extracts, a shared reporting view becomes worth considering.
Keep the count consistent
An order line may be linked to several receipt records. Count the source line once when measuring order-line frequency, then use the receipt records to examine fulfilment.
Give Colleagues a Common Reporting View
If the stores and procurement teams regularly have to pull two reports together, show the stock balance and the order history in the same reporting workspace. IntelliFront BI can host those views on infrastructure the organisation controls.
This stock dashboard comes from a separate example. It shows recorded balances by pack and location. To check the six orders in our worked example, you’d still need the dated orders and receipts. Select paracetamol 500 mg tablets and keep the pack size and location beside the balances. That helps you pick the 100-tablet row for Pharmacy Stores and leave the 12-tablet packs out of this comparison.
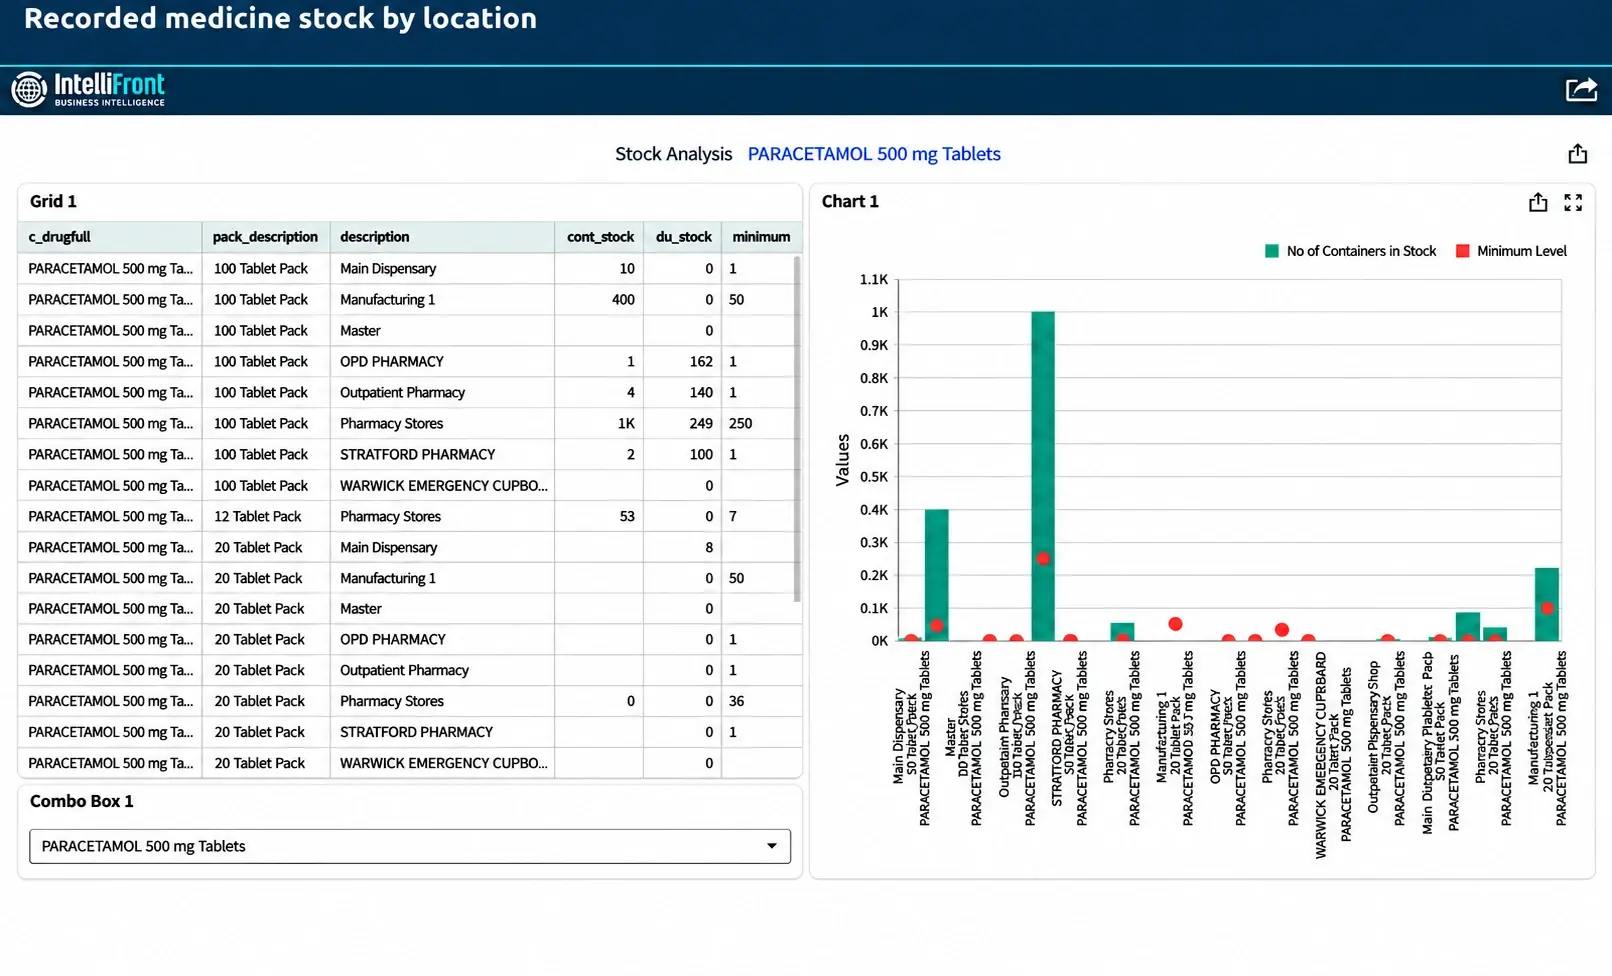
| Container stock | 1K, as displayed |
|---|---|
| Dose-unit stock | 249 dose units |
| Recorded minimum | 250 |
The dose-unit column shows 249 and the minimum column shows 250. Before treating that as a shortfall of one, ask the stores team whether the minimum uses the same unit and what the threshold means locally.
Put the dated orders, quantities and receipts beside the stock view. The stores colleague can check the balance, and the procurement lead can find the morning and afternoon orders without having to match two reports again.

Two useful time labels
Show the time of the stock balance and the period covered by the activity. A seven-day supply history describes movement over that period; a dated balance describes the recorded position.
Bring an Explained Pattern to the Stock Review
By Friday, the store had received 1,800 containers and issued 1,800. That explains the steady balance. The order dates answer a second question: on three days, someone placed one order in the morning and another five hours later. Each pair was fulfilled in a single receipt.
At the next meeting, the procurement lead can point to those three afternoon orders and ask what prompted them. An urgent request may explain one. A routine second order may be something the team can combine. Now they have specific transactions to discuss.
For your own review, take one item, one pack and one location. Account for the movement first, then lay out the orders by time. When someone asks why the item came up so often, you’ll have the dates and order numbers ready.
If pulling those records together is a regular job, see how hospital pharmacy stock dashboards can bring stock and ordering data into one view.
Contributors:
Christian Ofori-Boateng
CEO, ChristianSteven Software