See which prescriptions need review
A pharmacy team sees which prescriptions are awaiting review and how many are waiting on each ward. The team can use that view to plan its next round of reviews.
Explore NHS pharmacy dashboards

IntelliFront BI lets you build reports, dashboards and KPIs on your own infrastructure. Teams and customers can open the views you share with them in a browser.
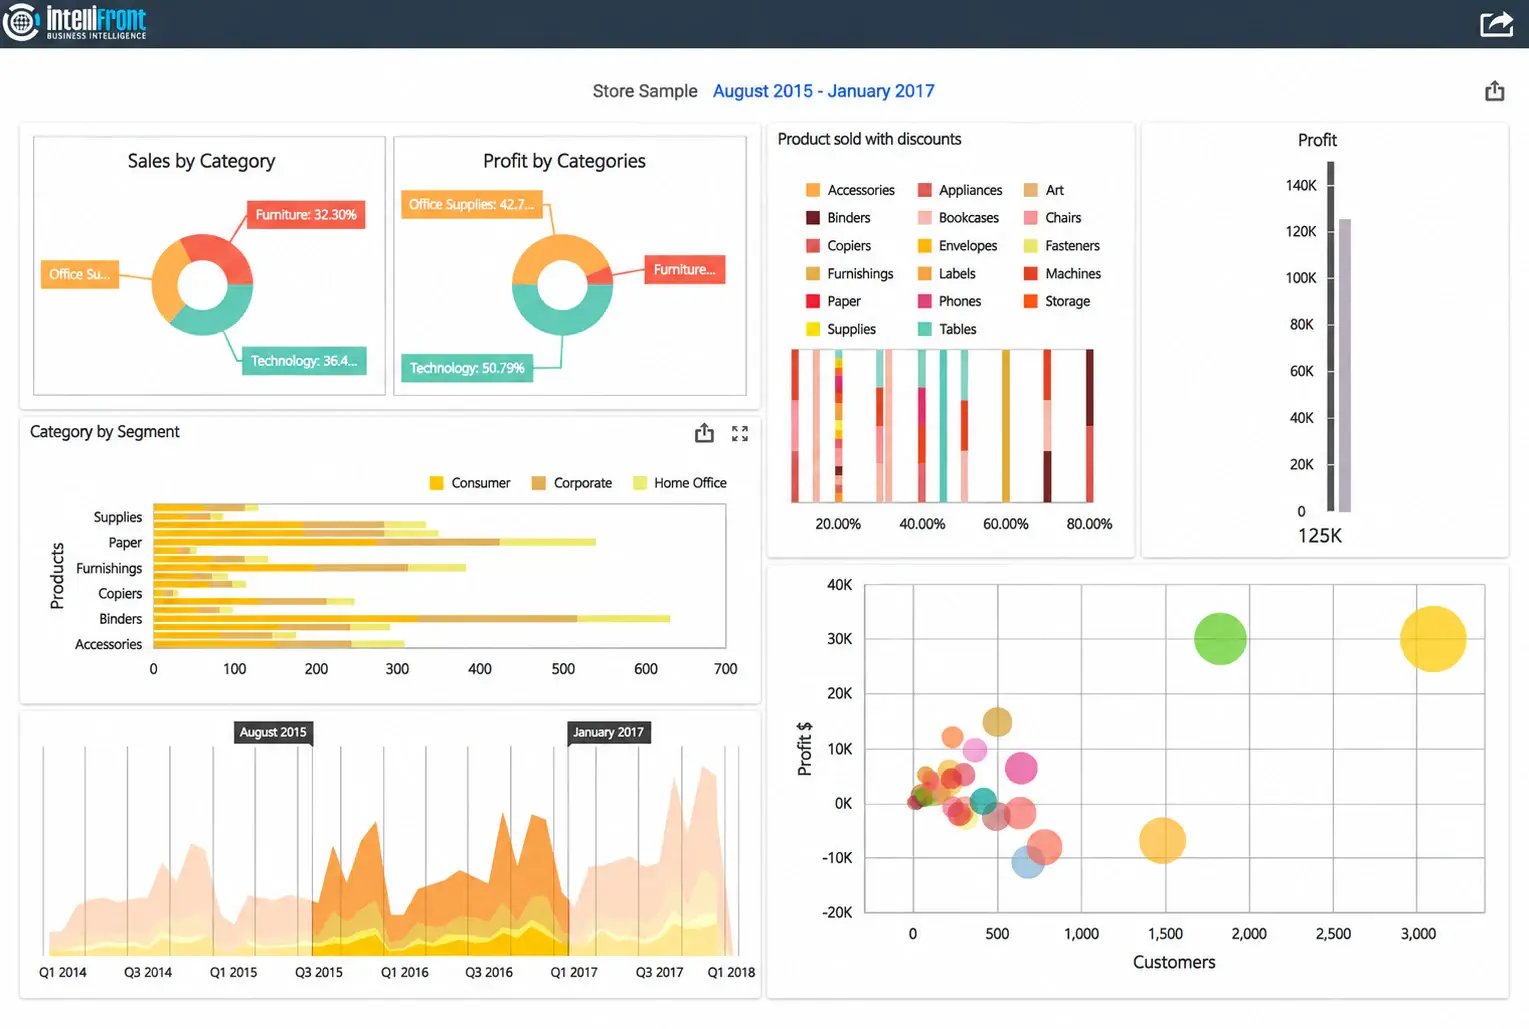
A pharmacy team sees which prescriptions are awaiting review and how many are waiting on each ward. The team can use that view to plan its next round of reviews.
Explore NHS pharmacy dashboardsCustomers can open their reports in a browser and see how activity has changed since their last service review.
Explore reporting for software customersGive each client one place to find the reports you prepare for them, so both teams can discuss the same figures.
Explore BI software for consultanciesAn operations supervisor can put workload, targets and exceptions on a shared screen. At handover, the incoming team can see what is still open and where to focus.
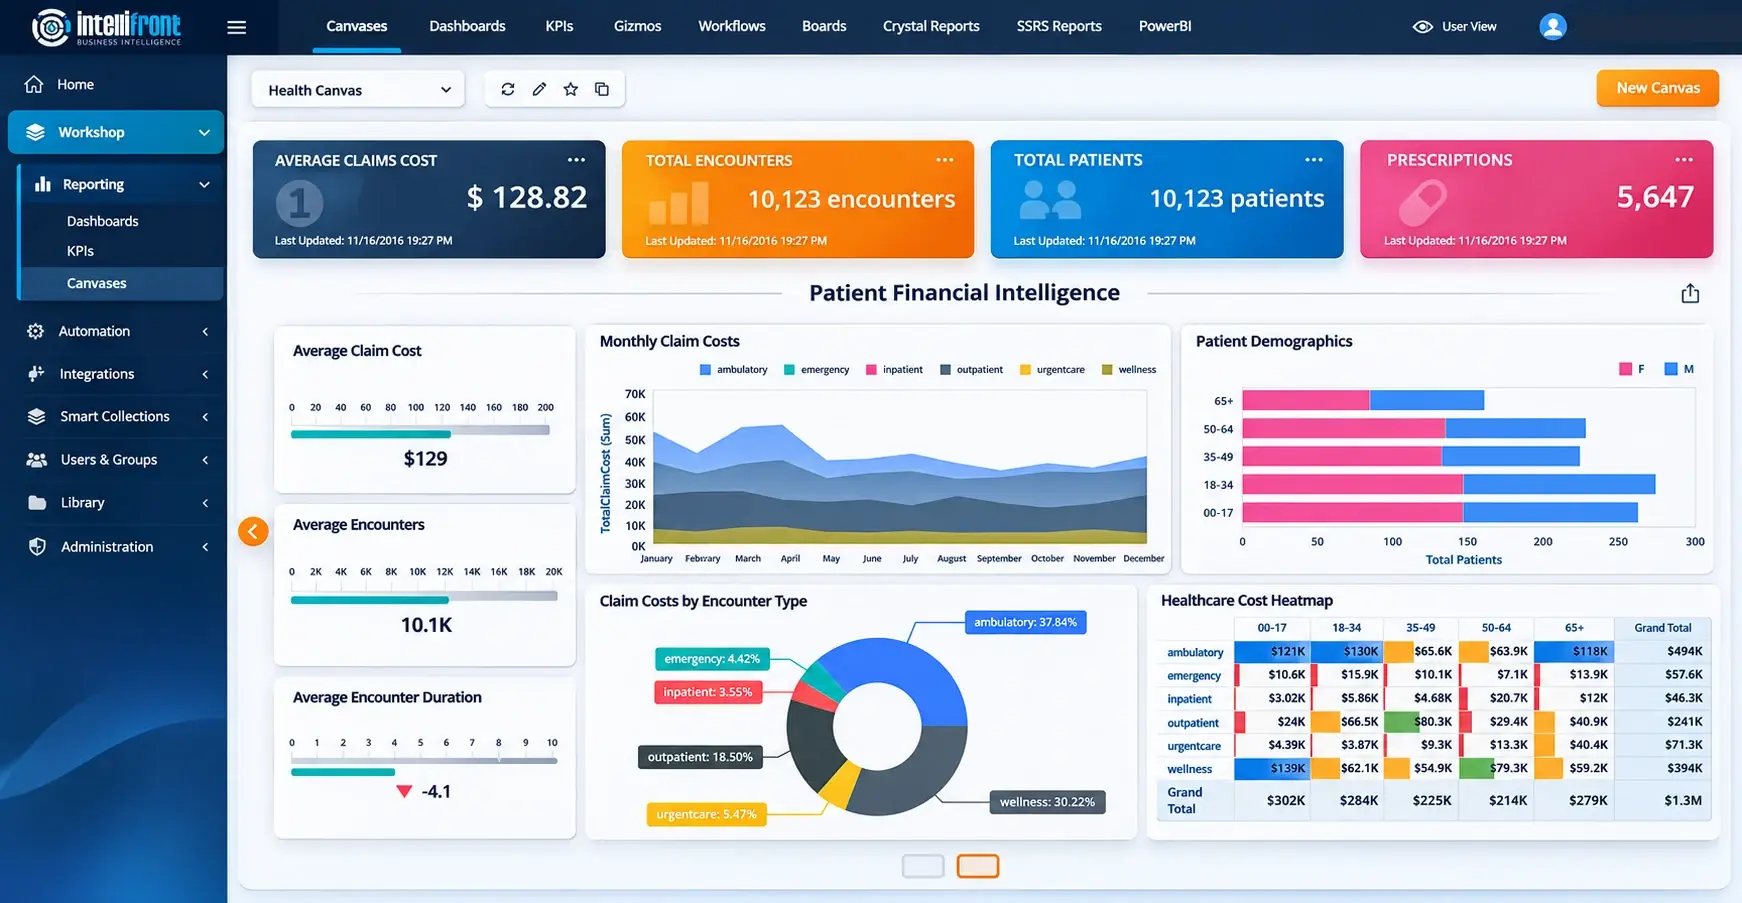
Explore operational screens and KPI wallboardsA Canvas is an IntelliFront BI workspace that brings dashboards and KPI cards together. This example shows the average claim cost, monthly claim costs and how costs break down by type of visit.
IntelliFront BI is self-hosted. Your organization runs the platform on its own infrastructure, and readers use a browser to open the reports and dashboards made available to them.
Start with the report, spreadsheet or database your team already uses. Identify the fields behind the numbers you want to show and how often those numbers need to be refreshed. Bring a small sample so you can check the dashboard against the source.
Think of a report your team checks before a review or handover. Explore how IntelliFront BI could bring the numbers they need into one view.