Build reports and dashboards
See how to turn data from databases or Excel into views your team can use in the browser.



Build reports and dashboards from your business data, then share them with colleagues, customers, and partners in one browser-based portal.
Personal reporting with Canvas
Start your day with the numbers you check most often and the dashboards that help you understand them. A Canvas puts the dashboards and KPI cards available to you together in a personal workspace.
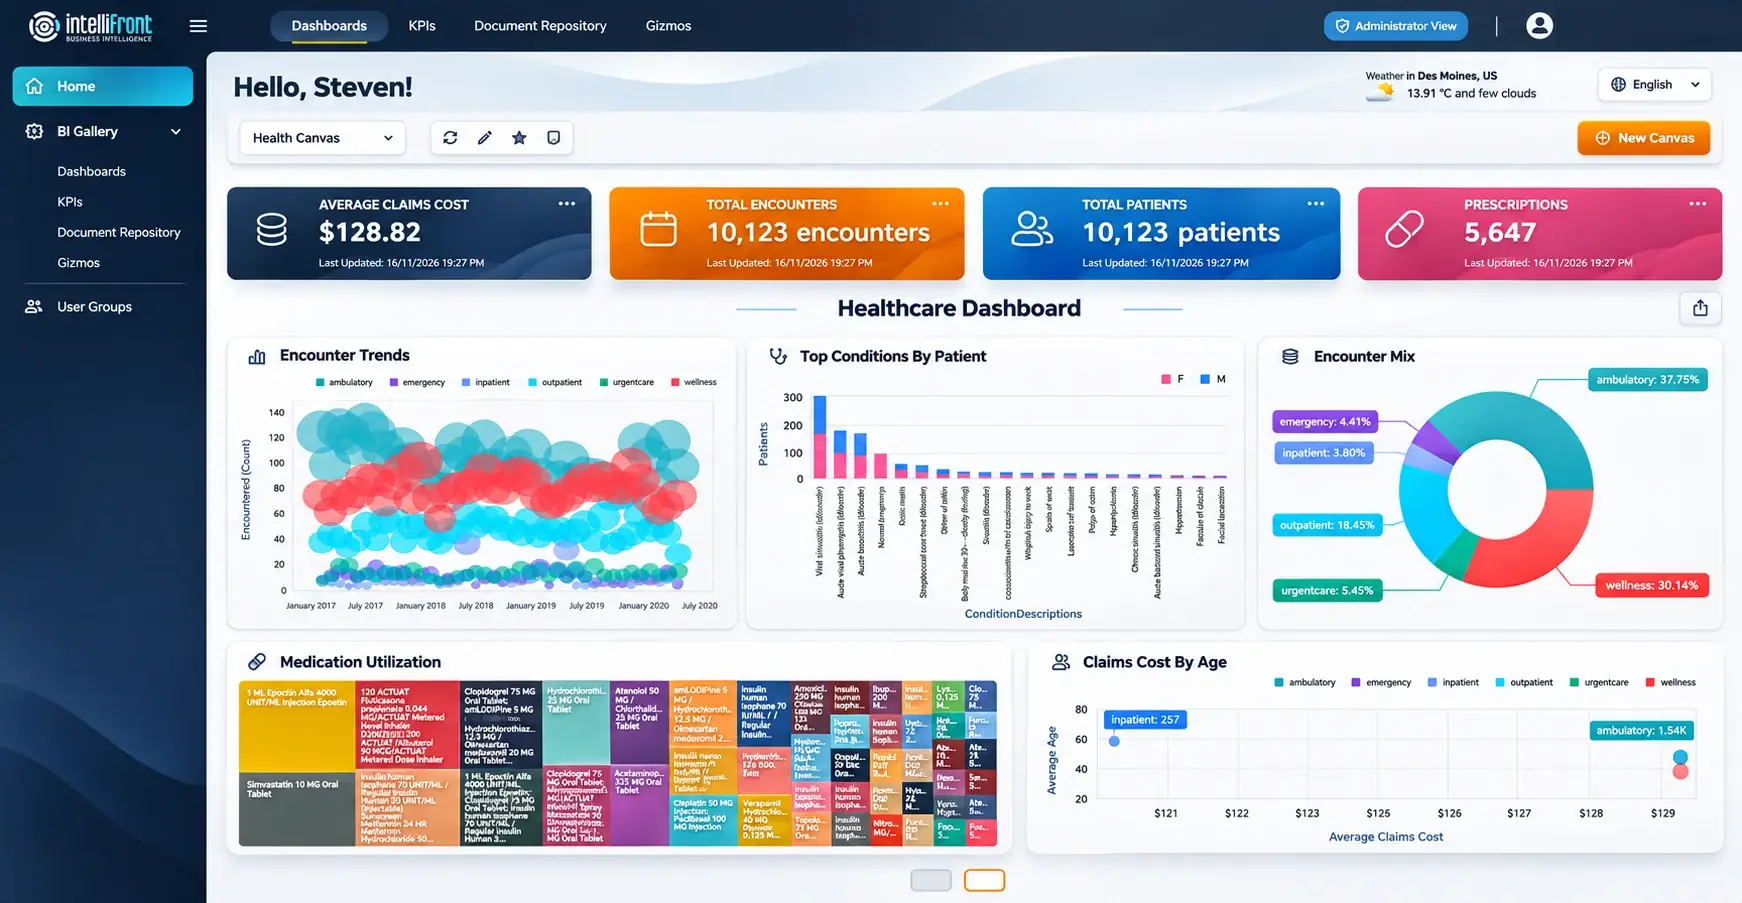
In this example, the cards give you a quick read on patient and prescription counts. The dashboard underneath shows how encounters change over time and how they break down, so you can see where to look more closely.
A ward pharmacist can start with prescriptions awaiting review and see which wards need attention. A pharmacy manager can start with activity across wards. Each person can make their preferred Canvas their home view, so the first screen shows the information they need for their role.
Built-In Report and Dashboard Design
Before planning a promotion, a sales manager wants to know which categories sell well and which contribute most to profit. A dashboard built in IntelliFront BI can put both figures side by side.
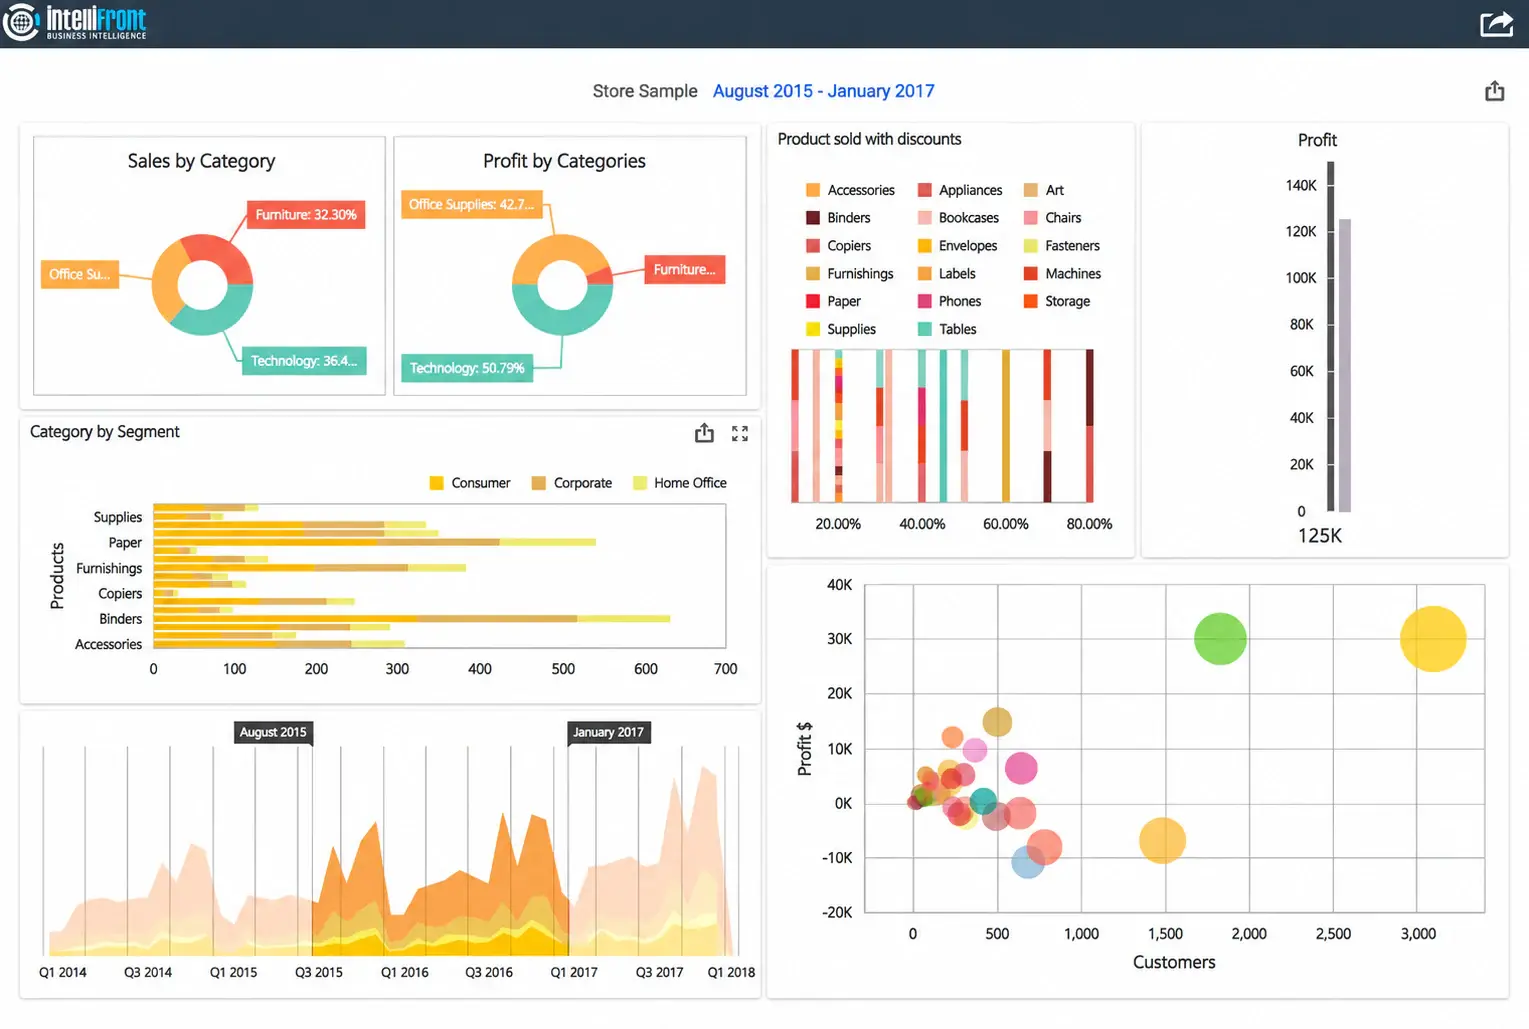
Actual IntelliFront BI interface · Sample data · Select the image to enlarge
A pivot table puts sales and profit side by side by category. A grid gives the manager the underlying figures to review when a category stands out.
A chart can show whether a strong category has performed consistently or had an unusually good month.
Calculations, filters, and parameters let the manager narrow the comparison to the period or product group that matters for the promotion.
Watch the Avocado Prices dashboard take shape in the IntelliFront BI designer.

Actual IntelliFront BI designer · Sample data
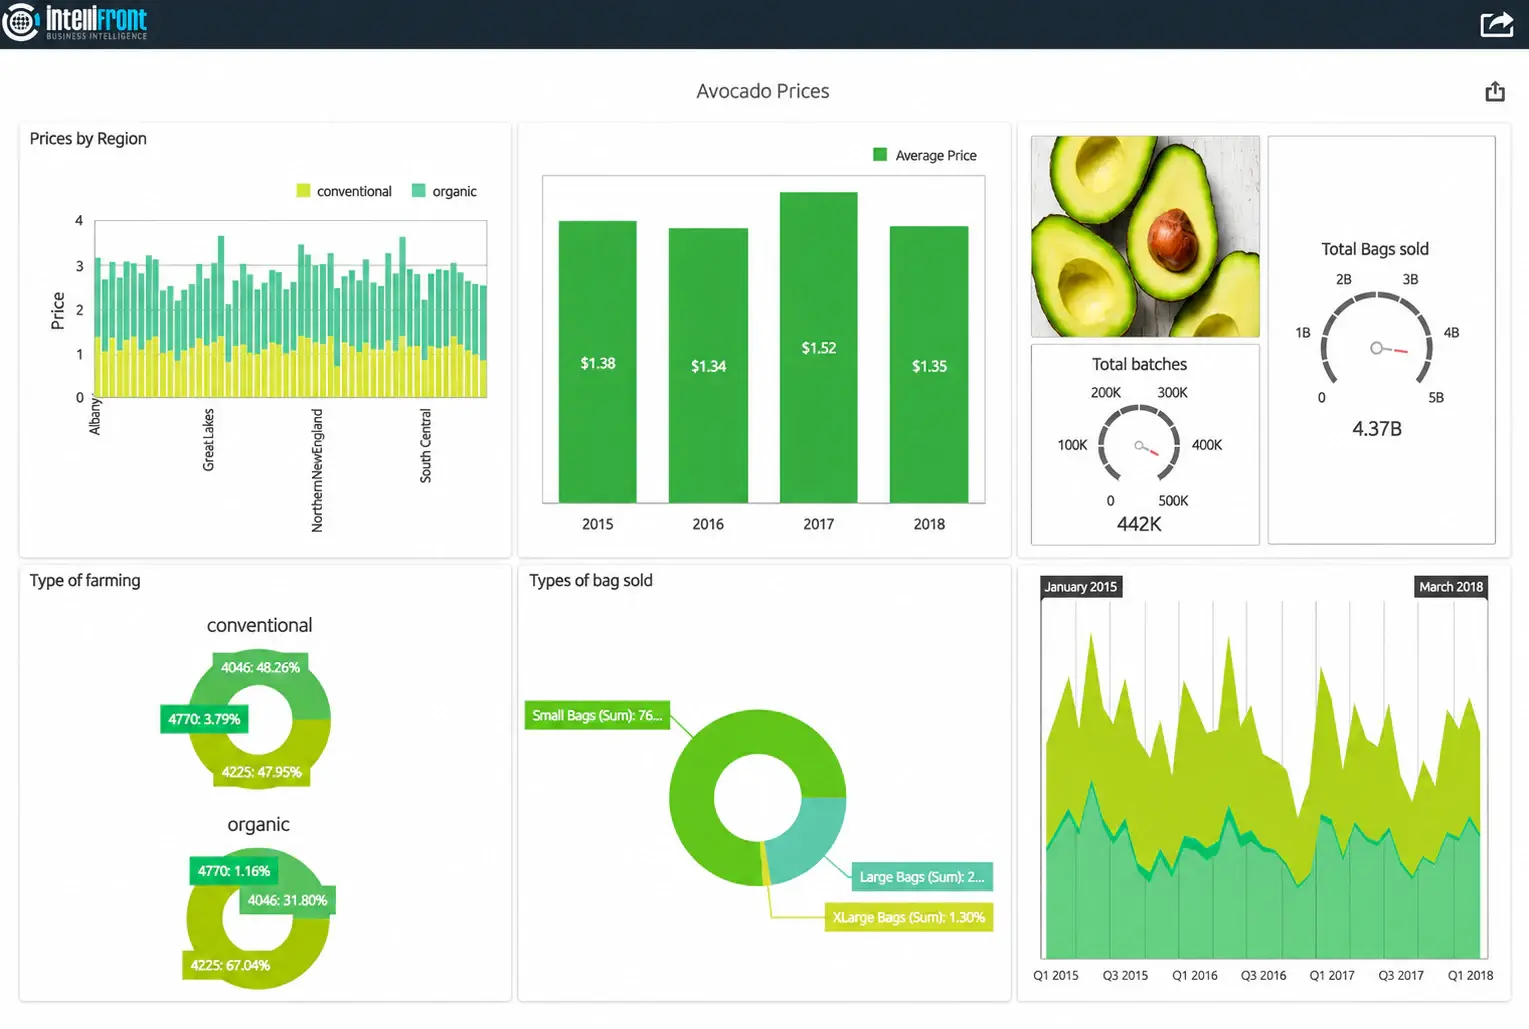
Compare avocado prices by year and region · Sample data
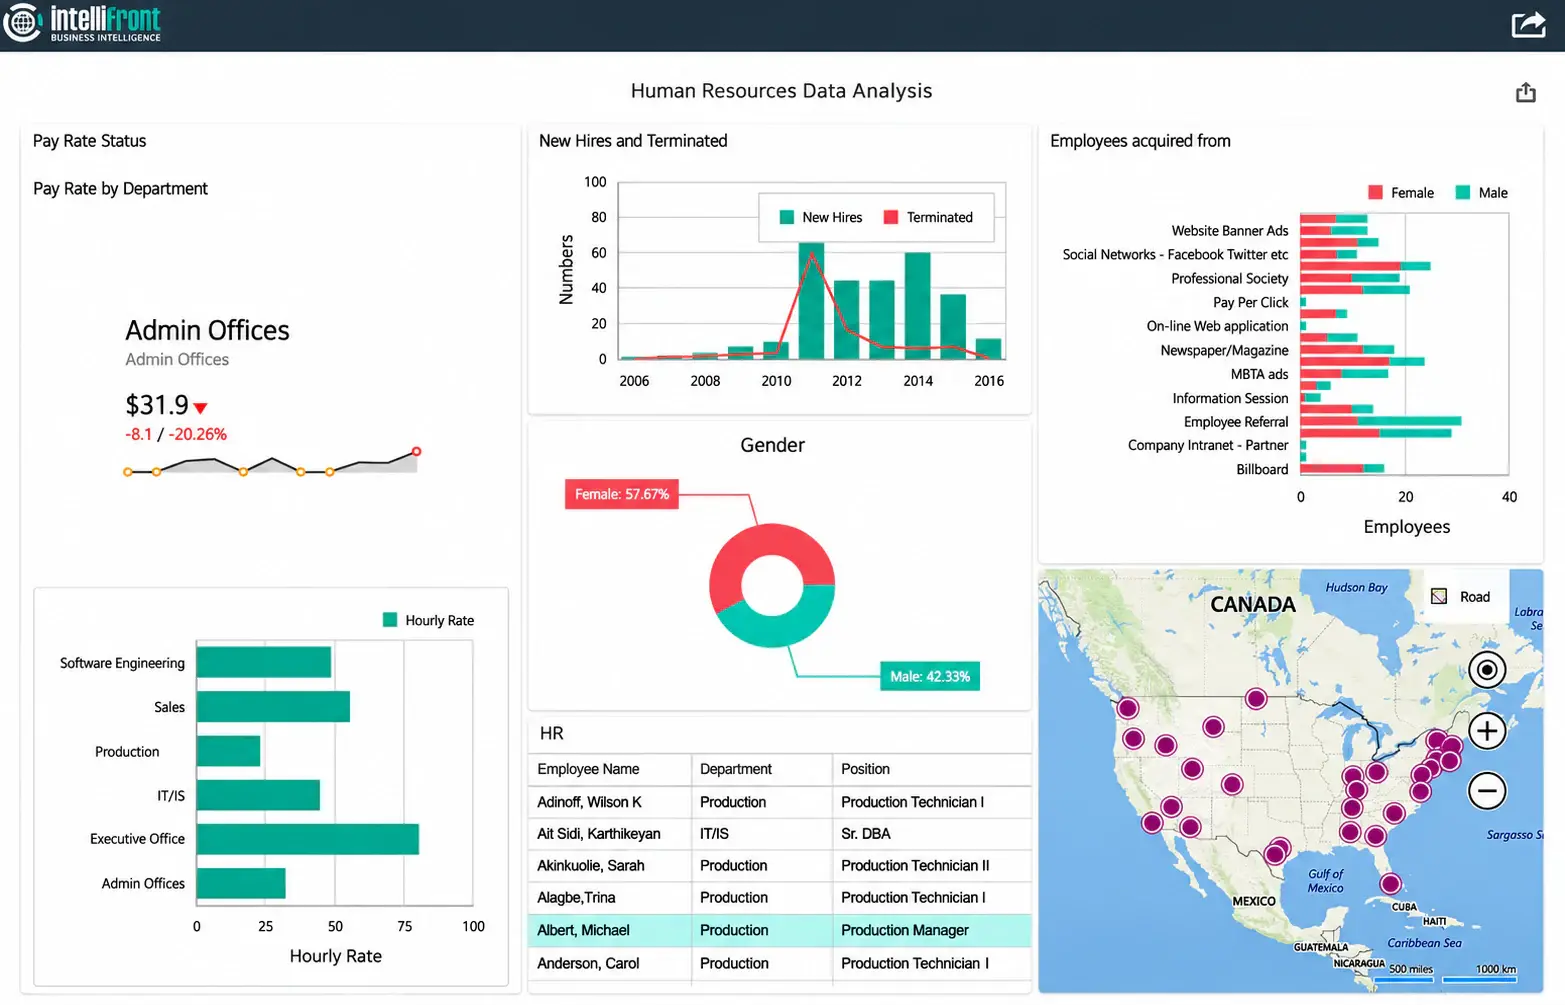
Explore geographic information · Sample data
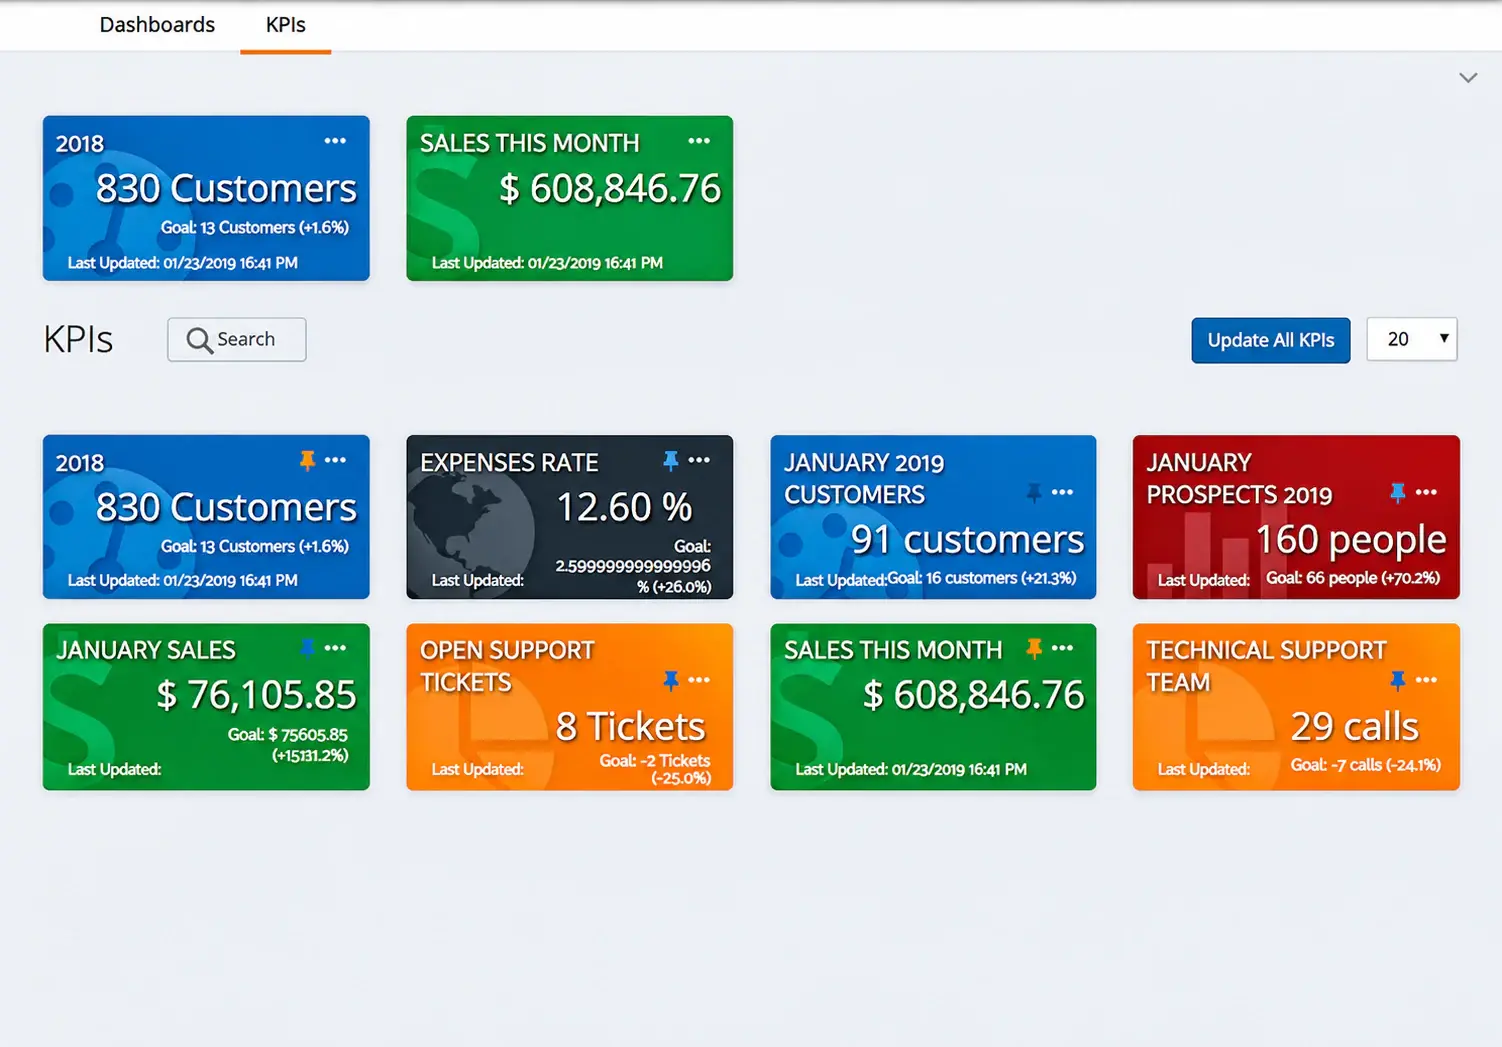
Review KPI measures · Sample data
Datasets and Queries
A useful dashboard starts with figures people trust. Prepare data from supported databases or Excel, check it against the source, and reuse the dataset when the next reporting question comes up.
For the sales dashboard, that means bringing together the sales, costs, categories, and dates that make the comparison meaningful.
Authors can shape the dataset with the query builder or SQL, then preview the records and check the totals before the manager relies on them.
Once the figures check out, use the same dataset in a dashboard or KPI. Set refresh and caching options around when the source changes and when readers need the latest figures.
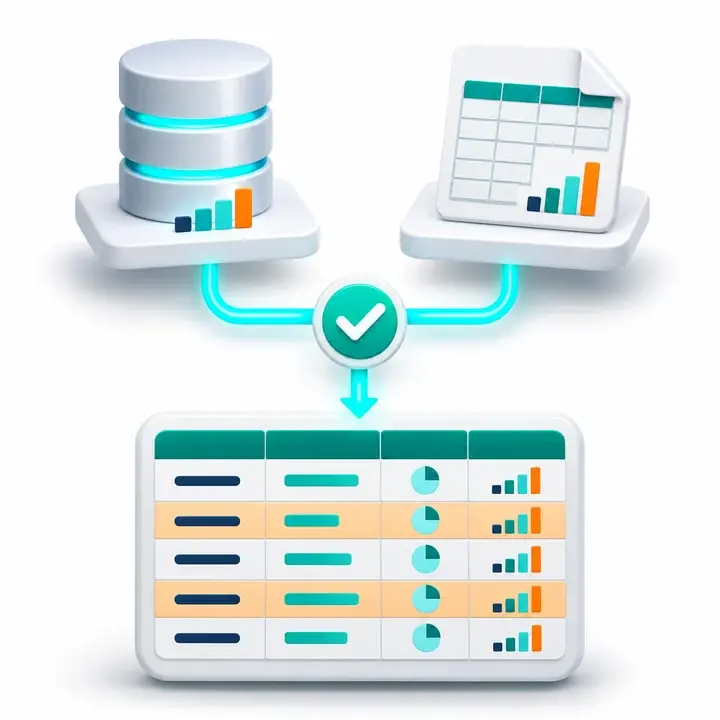
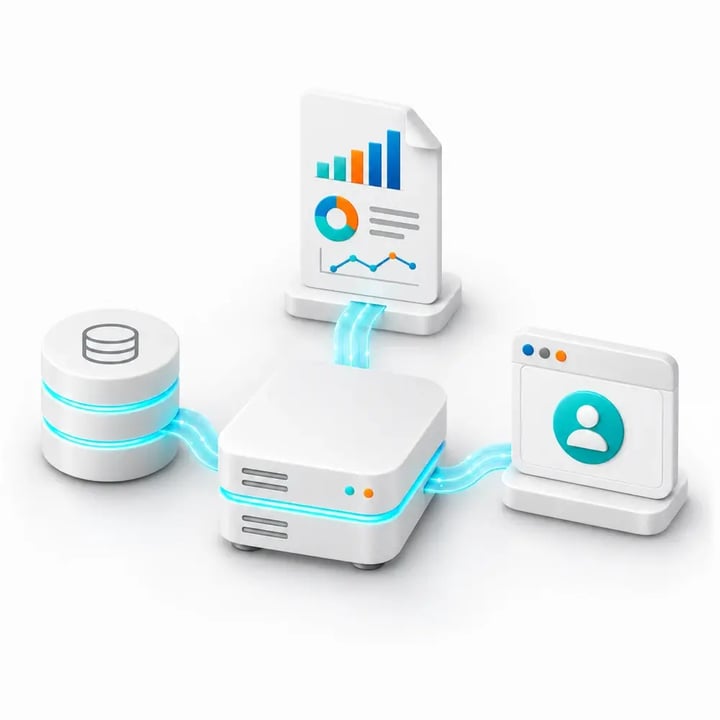
Concept illustration of business data used in native reporting
REPORTING ORGANIZED AROUND YOUR WORK
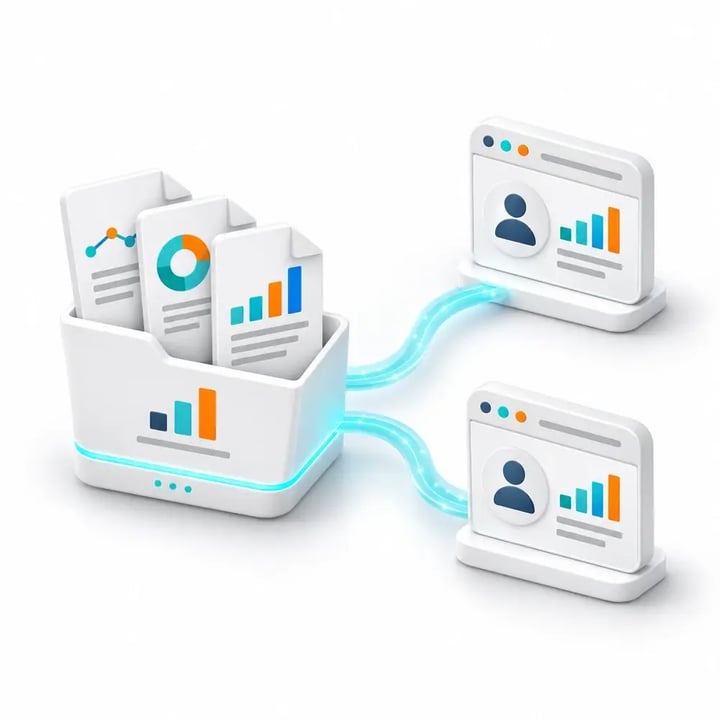
When it’s time for the month-end review, give people one place to find the dashboards, KPIs, and reports they need. A Smart Collection brings that material together using shared tags.
Tags can group reporting by department, customer, or subject. When a new report uses a matching tag, it can appear in the collection alongside the reports people already use.
Someone preparing for month end can go straight to the collection and see the items they have permission to use.
KPIS AND PERFORMANCE TARGETS
If your team’s limit is 25 open requests, a backlog of 35 tells the next shift it has ten more than the agreed limit.
Set the backlog KPI to show how many requests are open and how that count compares with your limit. Show when the count was taken so the next shift knows how current it is.
Maintain one calculation, unit, and goal for the KPI. A short description can explain what counts as outstanding work, so managers and staff discuss the same measure.
Explore KPI measures and goals → See how Canvases work →
Actual IntelliFront BI interface shown with sample data
Browser Access for Your Audiences
Customers and partners can open their reporting in a browser and see the information you make available to them. They’re included in IntelliFront BI’s unlimited-user licensing.
Give readers browser access to supported Crystal Reports and SQL Server Reporting Services (SSRS) reports alongside the dashboards you build in IntelliFront BI. You can also include configured Power BI content. The relevant source-platform licensing and permissions still apply.
A customer can review their account’s service performance, and a partner can check results for their locations. Sign-in, content permissions, and customer data restrictions determine what each audience can see.
Internal teams can use the same portal to review their department’s results and open supporting reports they’re allowed to see.
On Your Infrastructure
IntelliFront BI runs on infrastructure your organization manages. Your IT team looks after the environment, and reporting authors look after the reports, dashboards, and KPIs people use in their browser.
IT handles installation, connectivity, maintenance, and backups. Reporting owners can keep the content up to date within that environment.
Supported sign-in options include Active Directory, Microsoft sign-in, and two-factor authentication. User and group permissions help you match access to each role.
Your IT team can plan how employees and external readers will reach the portal and test the connection and access with an account for each audience.
We are a charity with projects all around the world. Using IntelliFront BI from ChristianSteven, we are now (finally !) able to report visually, geographically mapping the locations and sizes of our projects.
We are also producing real-time data which assists our Projects team in the management of their projects. We are respond to high-level queries from our directors, and provide good, consistent data in moments, rather than the days which it took before.
The output from IntelliFront BI is fast, easy to create, and can be visually stunning – the only limit is our imagination !
On the rare occasions we get stuck trying to do something, the folks at ChristianSteven have been swift (and patient) in helping us to resolve everything to our satisfaction.
Everyone in our company has been very impressed by what we are now able to produce, so impressed in fact, that we are using IntelliFront BI to provide user-friendly data from some of our other systems, in addition to the one for which this was originally purchased.

The benefits IntellIFront BI has brought to our hospital Trust are many: The visual display of KPIs for business cases; the ability to monitor performance against CQUIN guidance (The Commissioning for Quality and Innovation framework); control of the reports and refresh rates without input from IT; user access control, including secure multi-user access; the transfer of some responsibility back to clinical teams; the ability to view specific data by wards; and more.
The overarching benefit of IntelliFront BI is to improve patient safety and, as Paul P. (EPMA System Manager for University Hospitals Sussex NHS Foundation Trust) always likes to say, "data saves lives".

Working with ChristianSteven has been a pleasure. They are friendly, cooperative, flexible and strive to meet our needs.
IntelliFront BI has improved our reporting management system. We can incorporate our own documentation templates for each report, categorize reports into functional groups, and provide dashboards and KPI's geared to each customer's needs.
Our users like the interface. We can organize our reports, dashboards and KPI's by groups which helps our users find the reports they need quickly.